CS21 Lab 9: Climate Database: Sorting
Due Saturday, April 13, by 11:59pm
Goals
The goals for this lab assignment are:
-
Practice with sorting by different data fields
-
More practice working with real-world data
-
More practice working with a list of objects
-
More more practice using binary search
-
More practice programming with file I/O, and menu-driven program
-
More practice with top down design, functions, and incremental implementation and testing
Getting and Working on Lab09 Code
Make sure you are working in the correct directory when you edit and run lab 09 files.
Run update21 to get the starting point code of the next lab assignment.
This will create a new ~/cs21/labs/09 directory for your lab work.
Edit and run Lab 09 programs from within your cs21/labs/09
directory.
Make sure all programs are saved to your cs21/labs/09
directory! Files outside that directory will not be graded.
$ update21
$ cd ~/cs21/labs/09
$ pwd
/home/username/cs21/labs/09
$ ls
(should see your program files here)
Then edit and run program files in your ~/cs21/labs/09 directory:
$ code filename.py
$ python3 filename.py
Programming Tips
As you write programs, use good programming practices:
-
Use a comment at the top of the file to describe the purpose of the program (see example).
-
All programs should have a
main()function (see example). -
Use variable names that describe the contents of the variables.
-
Write your programs incrementally and test them as you go. This is really crucial to success: don’t write lots of code and then test it all at once! Write a little code, make sure it works, then add some more and test it again.
-
Don’t assume that if your program passes the sample tests we provide that it is completely correct. Come up with your own test cases and verify that the program is producing the right output on them.
-
Avoid writing any lines of code that exceed 80 columns.
-
Always work in a terminal window that is 80 characters wide (resize it to be this wide)
-
In
vscode, at the bottom right in the window, there is an indication of both the line and the column of the cursor.
-
Function Comments
All functions should have a top-level comment! Please see our function example page if you are confused about writing function comments.
Lab09 Overview
Climate scientists often use computer programs to simulate the interactions of the earth’s atmosphere, oceans, land surface, and ice, and also to analyze past data in order to understand the effects of human activity on the climate and to make predictions of future climate changes.
In this assignment you will write a program climate2.py that reads in
climate data from a file, and then allows the user to select a specific query
about the data from a menu of options and display the result.
This is the second assignment using these data. Much of the code you wrote for Lab 8 can be re-used for this assignment, leaving you to focus on sorting the data based on different field values.
The menu options for Lab09 are the following:
    ================== Menu ======================
    1. The n largest CO2 producing countries in given year
       (listed in order of largest to smallest CO2 emissions)
    2. The CO2 values for n countries with largest GDP in given year
       (listed in order of largest to smallest GDP)
    3. The n largest CO2/capita producing countries in a given year
       (listed in order of largest to smallest CO2/capita)
    4. Print a country's info
    5. Quit
|
Note that menu options 4 and 5 are identical to menu options 5 and 6 in Lab 8. As a result, the functions you used to implement these can be copied from Lab 8 (i.e, your binary search function, your function that handles option 4). There is one change you will need to make to handle option 4 correctly for this lab (details are discussed more below). In addition, the function(s) you wrote in Lab 8 for reading in
data from the data file, and for creating the list of Also note that this program is menu-driven like Lab 8. As a result, many of the function you wrote that handle displaying the menu options, reading in user input, and invoking an menu option’s function, can be copied over from Lab 8 and modified slightly (or used directly) in this lab. We have a library available for you to use with some Lab 8 functions. These may be useful in the case of your Lab 8 solution being incorrect or incomplete. |
The data we are using was obtained from Climate Watch. The professors cleaned up the raw data from this source for you, and created a file consisting of some historical annual carbon dioxide ("CO2") total emission amounts (in Megatons), gross domestic product (or GDP, in billions of US dollars), and population (in millions of people) data for most countries in the world.
However, like most real world data, there are some missing values in this data set, and your program will need to appropriately ignore missing values when computing the result of a user’s query on the data.
General Requirements
-
Your program should have many functions, including: reading in the data from the file, one for performing each operation, one for the main data processing loop, and some helper functions for sorting on different fields, reading in and checking input values in different ways. We leave many of the function definition and design up to you. You can reuse many of your functions from Lab 8.
-
Your program will implement several different sorting functions for sorting on different data fields of the
Countryobjects. You may use the same general sorting algorithm for each (e.g. Selection Sort), but you you will need different functions to sortCountryobjects on different fields for implementing individual menu options.-
You must implement sorting functions (you cannot use the
listclass'sortmethod). We recommend using Selection Sort, but any sort algorithm that we covered in class are fine to use.
-
-
You program should be well designed: use good modular design, have complete function comments, use descriptive variable names, have no line wrapping, and be robust to input errors; the requirements for each part of the assignment describe what types of bad input your program does and does not need to handle.
General Hints/Tips
-
Use what you know about good Top-down design and incremental implementation and testing to implement this large program. Do not try to complete it all in one sitting! Rather, implement and test each piece a little bit at a time.
-
Refer to in-class code for examples. You likely need to refer to code from many different weeks depending on the example you are looking for, as we’ve covered functions, while loops, formatted output, file I/0, searching, sorting, strings, lists, etc. over many weeks.
-
Use the
print()function to add debug statements to help you see what your program is doing as you try to find and fix bugs (and be sure to remove these after you fix the bugs, though!). -
You can reuse a lot of functions that you wrote in Lab 8, and use other functions as starting points for implementing similar functionality in this assignment.
Just copy your function code from Lab 8 into your
climate2.pyfile as you discover that you can use them in this lab.We also provide our solutions to some Lab 8 functions in a library (cs21S24_lab08lib) that you can import in your program in cases where your Lab 8 solution is incorrect or incomplete. With the details of each part below, we provide information on how to do this.
Example Run
The link below is output from an example run of a working program that chooses each menu option, some more than one time. Additionally, with the details of each Menu Option in the sections below, we also show example output of just that menu option.
The following are the details of each of the main parts of your program:
Create a List of Country Objects
The first thing your program will do is read in data from the file
and create a list of Country objects. Each country’s information is
on a single line of the file. Individual values are comma separated.
You can reuse your Lab 8 function for doing this. See this same section in the Lab 8 assignment page for more details about this part.
If you didn’t complete this part, you can use our get_climate_data function
from the cs21S24_lab08lib to perform this operation:
def  get_climate_data(filename):
    """
    This file processes a csv file containing climate data for
    different countries.  The file is assumed to be in sorted order
    by country name.  The format of the file is:
    Country name,1960,1980,2000,2020,2022,pop_1960,pop_2020,gdp_1960,gdp_2020

    filename: the name of the file
    returns: a list of Country objects, one per country in the file
    """
To import this function into your program add this to the top:
from cs21S24_lab08lib import get_climate_data|
about missing values
There are missing data for some fields of some countries. Missing
values are encoded as Your program needs to correctly handle any missing values correctly---do
not do arithmetic using Any field that stores a numeric value could have a missing value
(i.e, any CO2 value, population value, or GDP value could be A country’s name field will never be a missing: no country has
a name of |
The Country Class
The starter code imports the Country class that you should use.
Here is the complete information about the Country class and its
method functions: Country Class Documentation
Main Loop and the Menu
After your program reads in the file data and creates a list of
Country objects, it should call a function that, in a loop:
-
prints out a menu of options for the user to choose from
-
performs the operation on the data, and displays the results (some output needs to be in tabular form, details below)
Your program should repeat these steps until the user chooses the menu
option to quit.
The five menu options for getting information about the climate data set include:
-
Print out information about the n largest CO2 producing countries in a given year. Country name and CO2 level for the year should be printed out in decreasing sorted order (highest to lowest) based by CO2 levels.
-
Print out information about the n countries with the largest GDP in a given year. Country name and GDP value for the year should be printed out in decreasing sorted order based by GDP levels.
-
Print out information about the n largest CO2/capita producing countries in a given year. Country CO2/population, population, CO2 and country name for the year should be printed out in decreasing sorted order based by CO2/population levels.
-
Print out all information about a country given its name entered by the user.
-
Quit
Example Output: Menu
Here is example output from a working program that reads in the
data, prints out the menu, reads in an option from the user with 5 as the
quit option, and performs the action (note how it handles
bad input values):
$ python3 climate2.py
There are data for 193 countries in this file

================== Menu ======================
1. The n largest CO2 producing countries in given year
   (listed in order of largest to smallest CO2 levels)
2. The CO2 values for n countries with largest GDP in given year
   (listed in order of largest to smallest GDP)
3. The n largest CO2/population producing countries in a given year
   (listed in order of largest to smallest CO2/population levels)
4. Print a country's info
5. Quit

Select a menu option
Enter a value between 1 and 5: 9
  9 is not a valid choice, try again
Enter a value between 1 and 5: 7
  7 is not a valid choice, try again
Enter a value between 1 and 5: -3
  -3 is not a valid choice, try again
Enter a value between 1 and 5: 5
bye bye
Required Features
-
Your program should list the 5 menu options in the exact order as the example shown above. Do not choose a different ordering of operations on the data (e.g., option
4needs to print out a country’s information after prompting the user to enter the country’s name). -
Your program should gracefully handle, and re-prompt for, invalid menu options entered by the user. You should use your Lab 8 function,
get_value_betweenthat takes a string with instructions (like"Select a menu option") and two int values, low and high, and returns a value betweenlowandhighinclusive. If the user passes in alowvalue that is larger than thehighvalue, the function should returnlow. Recall that this function assumes that the user enters an int value (i.e., if if the user enters a non-numeric value (like the string value "hello") this function crashes, which is fine). -
Menu option
5(quit) should be implemented with this step. Print out a good bye message and return from your main menu function back tomain. -
Your main menu looping should work at this point. For menu options not yet implemented, just print out the menu option selected by the user, and then your function should repeat its main actions: print out the menu; get the next selection from the user; repeat.
-
Feel free to add any other helper functions you’d like.
Hints/Tips
-
If you did not implement the
get_value_betweenfunction in Lab 8, you can use our implementation by importing out Lab 8 library into your program. Add to the top of your file:from cs21S24_lab08lib import get_value_betweendef get_value_between(low, high, directions): """ return a value between low and high low: the low range (int) high: the high range (int) directions: instructions (not prompt) to user on what to input (string) """Example call:
choice = get_value_between(1, 5, "Select a Menu Option") -
Refer to the in-class programs and to previous lab assignments that use while-loops and functions.
-
Refer to the Country Class Documentation for methods that might be helpful for implementing this menu option.
Menu Option 1
Implement a function to perform menu option 1: print out information about the n countries with the highest emissions in a given year. They should be printed in tabular format in decreasing sorted order by CO2 amount.
Be sure to read the "Required Features" and "Hints/Tips" before you start implementing this part.
Example Output
Here is some example output from this option:
$ python3 climate2.py
There are data for 193 countries in this file

================== Menu ======================
1. The n largest CO2 producing countries in given year
2. The CO2 values for n countries with largest GDP in given year
3. The n largest CO2/population producing countries in a given year
4. Print a country's info
5. Quit

Select a menu option
Enter a value between 1 and 5: 1

Pick a value for n
Enter a value between 1 and 193: 200
200 is not a valid choice, try again
Enter a value between 1 and 193: 10

Enter a year (one of 1960, 1980, 2000, 2020, 2022): 1888
1888 is not a valid value, try again
Enter a year (one of 1960, 1980, 2000, 2020, 2022): 1960


 1960      Emissions in Mt          Country
 -------------------------------------------------------
  1.         2897.315300          United States of America
  2.         2099.370900          European Union (27)
  3.          884.554900          Russia
  4.          813.950200          Germany
  5.          798.799900          China
  6.          584.020000          United Kingdom
  7.          296.114100          France
  8.          280.891300          Ukraine
  9.          232.499600          Japan
 10.          199.577100          Poland

================== Menu ======================
1. The n largest CO2 producing countries in given year
2. The CO2 values for n countries with largest GDP in given year
3. The n largest CO2/population producing countries in a given year
4. Print a country's info
5. Quit

Select a menu option
Enter a value between 1 and 5: 1

Pick a value for n
Enter a value between 1 and 193: 193

Enter a year (one of 1960, 1980, 2000, 2020, 2022): 1980

 1980      Emissions in Mt          Country
 -------------------------------------------------------
  1.         4808.556400          United States of America
  2.         4077.500700          European Union (27)
  3.         2129.110300          Russia
  4.         1494.495900          China
  5.         1100.066000          Germany
  6.          944.868600          Japan
  7.          674.859700          Ukraine
  8.          579.035400          United Kingdom
  9.          511.046700          France
...
181.            0.029312          Kiribati
182.            0.021984          Bhutan

11 of the top 193 CO2 emitters do not have CO2 data for 1980

========  Menu Options: ========
...
Required Features
-
This option must be implemented in a separate function: don’t include its code in your function that gets the menu option. Instead, that function should make a call to your function that implements this feature when the user selects menu option 1.
-
Use your
get_value_in_setfunction from Lab 8 that takes a list of values and a prompt string and returns the user’s entered choice from one of the values in the set. If you did not get this working for Lab 8, you can use our version by importing it from our library. See the Hints section for how to do this. See Lab 8 for details of this function definition. -
Use your helper function,
get_value_betweento get a value forn(a value between 0 and and the number of countries in the database). If you did not get this working for Lab 8, you use can our version by importing it from our library. See the Hints section for how to do this. See Lab 8 for details of this function definition. -
Your algorithm to implement this option should first sort the list of Country objects by CO2 levels in the given year, and then it can get information for the first
nCountry objects in the resulting sorted list. -
The output should be in decreasing sorted order by the CO2 level (so so the country listed as number 1 is the largest CO2 emitter in the given year)
-
The output should be in tabular format that includes:
-
the rank (numbered 1-n)
-
the CO2 Mt emissions for the year
-
the country’s name
-
-
You should print out header line labeling each value in the tabular output.
-
Use formatted
printto ensure that the values line up vertically in the output. -
CO2 values should be printed with 6 places beyond the decimal point. For example,
%12.6fis a placeholder for a float value, printed in a field width of12with6places beyond the decimal point.
-
-
You should handle missing values from the data set and ignore them in your output. However, you should keep a count of all missing values, and at the end of your listing print out a message saying how many of the top n emitters do not have CO2 data for for that year. The example output above, shows an example of this.
Missing values are represented with
-1in the data file. Note: any field in a Country object that stores a numeric value could be missing (i.e, a CO2 value, a population value or a GDP value). A country’s name will note be a missing value. -
Use methods of the
Countryclass to access appropriate values from each country’s data: TheCountryClass
Hints/Tips
-
Look at example in-class code for lists, searching, objects, and output formatting.
-
Copy over functions in Lab 8, that you can use for this feature. If you did not get yours working, you can use our version by importing one or both of them from our library:
from cs21S24_lab08lib import get_value_in_set

from cs21S24_lab08lib import get_value_between
def get_value_in_set(set, prompt): """ returns an int value entered by the user that is one of the values in the passed set of values set: a list of options that the user can enter (list of int) prompt: the prompt (string) return: a value from the set (int) """ def get_value_between(low, high, directions): """ return a value between low and high low: the low range (int) high: the high range (int) directions: instructions (not prompt) to user on what to input (string) """ -
Try running your program on the smaller file to help you debug, then comment out this call from main and try on the bigger file.
-
You may add other helper functions to implement this feature if you’d like.
-
Refer to the Country Class Documentation for methods that might be helpful for implementing this menu option.
Menu Option 2
Implement a function to perform menu option 2: list the CO2 and GDP information for the n countries with the highest GDP in the given year. The n countries should be listed in order from highest to lowest GDP.
Be sure to read the "Required Features" and "Hints/Tips" before you start implementing this part.
Example Output
Here is some example output from this option:
% python3 climate2.py
There are data for 193 countries in this file

================== Menu ======================
1. The n largest CO2 producing countries in given year
2. The CO2 values for n countries with largest GDP in given year
3. The n largest CO2/population producing countries in a given year
4. Print a country's info
5. Quit

Select a menu option
Enter a value between 1 and 5: 2

Pick a value for n
Enter a value between 1 and 193: 5

Enter a year (one of 1960 or 2020): 198
198 is not a valid value, try again
Enter a year (one of 1960 or 2020): 2020

 2020      CO2(Mt)           GDP(B)        Country
 ------------------------------------------------------------
  1.     4714.628000     20893.743830     United States of America
  2.     2629.970600     15300.141970     European Union (27)
  3.    10914.012200     14687.673890     China
  4.     1039.795900      5040.107754     Japan
  5.      647.252300      3846.413929     Germany

================== Menu ======================
1. The n largest CO2 producing countries in given year
2. The CO2 values for n countries with largest GDP in given year
3. The n largest CO2/population producing countries in a given year
4. Print a country's info
5. Quit

Select a menu option
Enter a value between 1 and 5: 2

Pick a value for n
Enter a value between 1 and 193: 193

Enter a year (one of 1960 or 2020): 2020

 2020      CO2(Mt)           GDP(B)        Country
 ------------------------------------------------------------
  1.     4714.628000     20893.743830     United States of America
  2.     2629.970600     15300.141970     European Union (27)
  3.    10914.012200     14687.673890     China
  4.     1039.795900      5040.107754     Japan
  5.      647.252300      3846.413929     Germany
  6.      326.263200      2756.900214     United Kingdom
...
184.        0.065952         0.180912     Kiribati
185.        0.051296         0.114627     Nauru
186.        0.010992         0.055055     Tuvalu

7 of top 193 have missing CO2 or GDP data for 2020


========  Menu Options: ========
...
Required Features
-
This option must be implemented in a separate function: don’t include its code in your function that gets the menu option. Instead, that function should make a call to your function that implements this feature when the user selects menu option 2.
-
Use your helper function,
get_value_in_setto get a value for the year from the user (one of 1960 or 2020), which are the two years with GDP values). See Option 1 for information about how to use ours if you don’t have this function from your Lab 8. -
Use your helper function,
get_value_betweento get a value forn(a value between 0 and and the number of countries in the database). See Option 1 for information about how to use ours if you don’t have this function from your Lab 8. -
Your algorithm to implement this option should first sort the list of Country objects by GDP value in the given year, and then it can get information for the first
nCountry objects in the resulting sorted list. -
The output should be in decreasing sorted order by the GDP (so so the country listed as number 1 has the largest GDP emitter in the given year)
-
The output should be in tabular format that includes:
-
the rank (numbered 1-n)
-
the CO2 Mt emissions for the year
-
the GDP in (B) the year
-
the country’s name
-
-
You should print out header line labeling each value in the tabular output, and include the year in the header.
-
Use formatted
printto ensure that the values line up vertically in the output. -
CO2 and GDP values should be printed with 6 places beyond the decimal point. For example,
%13.6fis a placeholder for a float value, printed in a field width of13with6places beyond the decimal point.
-
-
You should handle missing values from the data set and ignore them in your output. However, you should keep a count of all missing values, and at the end of your listing print out a message saying how many of the top n emitters do not have CO2 data for for that year.
The second example in the output above shows an example of this.
Missing values are represented with
-1in the data file. Note: any field in a Country object that stores a numeric value could be missing (i.e, a CO2 value, a population value or a GDP value). A country’s name will note be a missing value. -
Use methods of the
Countryclass to access appropriate values from each country’s data: TheCountryClass
Hints/Tips
-
Try running your program on the smaller file to help you debug, then comment out this call from main and try on the bigger file.
-
You may add other helper functions to implement this feature if you’d like.
-
Refer to the Country Class Documentation for methods that might be helpful for implementing this menu option.
Menu Option 3
Implement a function to perform menu option 3: print out information about the top n CO2/capita producing countries in a given year. The n countries should be listed in order from highest to lowest CO2/capita.
Be sure to read the "Required Features" and "Hints/Tips" before you start implementing this part.
Example Output
Here is some example output from this option:
================== Menu ======================
1. The n largest CO2 producing countries in given year
2. The CO2 values for n countries with largest GDP in given year
3. The n largest CO2/population producing countries in a given year
4. Print a country's info
5. Quit

Select a menu option
Enter a value between 1 and 5: 3

Pick a value for n
Enter a value between 1 and 193: 7

Enter a year (one of 1960 or 2020): 2020

 2020   CO2(Mt)/M people     CO2(Mt)       Population(M)    Country
 ----------------------------------------------------------------------
  1.       35.577600       102.501200         2.881060     Qatar
  2.       25.376757        11.101900         0.437483     Brunei
  3.       25.030315        35.029700         1.399491     Trinidad and Tobago
  4.       22.880449        97.712400         4.270563     Kuwait
  5.       21.977124        37.395900         1.701583     Bahrain
  6.       21.917041       216.768300         9.890400     United Arab Emirates
  7.       17.543957       610.773000        34.813867     Saudi Arabia

================== Menu ======================
1. The n largest CO2 producing countries in given year
2. The CO2 values for n coutries with largest GDP in given year
3. The n largest CO2/population producing countries in a given year
4. Print a country's info
5. Quit

Select a menu option
Enter a value between 1 and 5: 3

Pick a value for n
Enter a value between 1 and 193: 193

Enter a year (one of 1960 or 2020): 1960


 1960   CO2(Mt)/M people     CO2(Mt)       Population(M)    Country
 ----------------------------------------------------------------------
  1.       36.652546        11.507800         0.313970     Luxembourg
  2.       28.982329         7.797000         0.269026     Kuwait
  3.       16.036416      2897.315300       180.671000     United States of America
  4.       12.105945        14.666800         1.211537     Estonia
  5.       11.178347       813.950200        72.814900     Germany
  6.       11.145420       584.020000        52.400000     United Kingdom
...
174.        0.007977         0.080608        10.105060     Nepal
175.        0.000000         0.000000         0.063689     Vanuatu
176.        0.000000         0.000000         0.041700     Seychelles
177.        0.000000         0.000000         0.502733     Botswana
178.        0.000000         0.000000         0.041196     Kiribati


15 of top 193 have missing CO2 or population data for 1960

================== Menu ======================
...|
The exact ordering of countries with the same value on the sort field is not specified. It may vary due to the specific sorting algorithm that is used or due to the order of the data prior to choosing this menu option. For example, the last 4 countries listed above all have a CO2/capita value of
|
Required Features
-
This option must be implemented in a separate function: don’t include its code in your function that gets the menu option. Instead, that function should make a call to the your function that implements this feature when the user selects menu option 3.
-
Use your helper function,
get_value_in_setto get a value for the year from the user (one of 1960 or 2020), which are the two years with Population values). See Option 1 for information about how to use ours if you don’t have this function from your Lab 8. -
Use your helper function,
get_value_betweento get a value forn(a value between 0 and and the number of countries in the database). See Option 1 for information about how to use ours if you don’t have this function from your Lab 8. -
Your algorithm to implement this option should first sort the list of Country objects by CO2/population value in the given year, and then it can get information for the first
nCountry objects in the resulting sorted list. -
The output should be in decreasing sorted order by the CO2/capita (so so the country listed as number 1 has the largest CO2/capita in the given year)
-
The output should be in tabular format that includes:
-
the rank (numbered 1-n)
-
the CO2/capita Mt/M emissions for the year
-
the CO2 (Mt) emissions for the year
-
the Population (M) for the year in
-
the country’s name
-
-
You should print out header line labeling each value in the tabular output, and include the year in the header.
-
Use formatted
printto ensure that the values line up vertically in the output. -
CO2, CO2/capita, and Population values should be printed with 6 places beyond the decimal point. For example,
%12.6fis a placeholder for a float value, printed in a field width of12with6places beyond the decimal point.
-
-
You should handle missing values from the data set and ignore them in your output. However, you should keep a count of all missing values, and at the end of your listing print out a message saying how many of the top n emitters do not have CO2 or Population data for for that year.
The second example in the output above shows an example of this.
Missing values are represented with
-1in the data file. Note: any field in a Country object that stores a numeric value could be missing (i.e, a CO2 value, a population value or a GDP value). A country’s name will note be a missing value. -
Use methods of the
Countryclass to access appropriate values from each country’s data: TheCountryClass
Hints/Tips
-
Try running your program on the smaller file to help you debug, then comment out this call from main and try on the bigger file.
-
You may add other helper functions to implement this feature if you’d like.
-
Refer to the Country Class Documentation for methods that might be helpful for implementing this menu option.
Menu Option 4
Implement a function to perform menu option 4: print out a country’s information.
Be sure to read the "Required Features" and "Hints/Tips" before you start implementing this part.
|
This is exactly the same option 5 as in Lab 8. However, in this lab the data are not necessarily sorted by countries' names, as the user may have selected previous menu options that sorted the database on other fields. As a result, you need to first sort the list by country name and then use binary search to find a matching country to print its data. |
Example Output
Here is some example output from this option:
================== Menu ======================
1. The n largest CO2 producing countries in given year
2. The CO2 values for n coutries with largest GDP in given year
3. The n largest CO2/population producing countries in a given year
4. Print a country's info
5. Quit

Select a menu option
Enter a value between 1 and 5: 4

Enter the name of a country: Greece

Greece
  1960 pop:     8.331725  2020 pop:    10.700556
  1960 GDP:     4.335186  2020 GDP:   188.835202
          1960         1980         2000         2020         2022
      9.391500    50.888700   102.973200    55.619800    59.662800

================== Menu ======================
1. The n largest CO2 producing countries in given year
2. The CO2 values for n coutries with largest GDP in given year
3. The n largest CO2/population producing countries in a given year
4. Print a country's info
5. Quit

Select a menu option
Enter a value between 1 and 5: 4

Enter the name of a country: hello

Sorry, hello is not in the database

========  Menu Options: ========
...
Required Features
-
You can reuse the function that you implemented in Lab 8 for Option 5. However, you must first sort the list of
Countryobjects by their names so that you can use binary search to find a matching country in the list. -
You must use binary search to find the country with a matching name in your list of
Countryobjects. If you didn’t implement binary search function in Lab 8 you can use ourbinary_searchfunction by importing it into your program. See Hints below for how to do this. -
This option must be implemented in a separate function: don’t include its code in your function that gets the menu option. Instead, that function should make a call to the your function that implements this feature when the user selects menu option 5.
-
You may print out the country’s information by calling
printfunction passing in theCountryobject. (See the Country Class Documentation) -
If the country is not in the database, print out a message saying it is not present.
-
Your program does not need to handle user’s entering a country’s name in the wrong case. For example, if the user enters
greeceinstead ofGreece, it is fine if your program prints out thatgreeceis not in the database.
Hints/Tips
-
Try running your program on the smaller file to help you debug, then comment out this call from main and try on the bigger file.
-
You may add other helper functions to implement this feature if you’d like.
-
Refer to the Country Class Documentation for methods that might be helpful for implementing this menu option.
-
If you did not get binary search working for Lab 8, you can use our version by importing it from our library:
from cs21S24_lab08lib import binary_searchThe function definition is:
def binary_search(data, value):
    """
    performs binary search on a list of Country objects sorted by their names
    data: list of climate info in increasing sorted order by name
          (list of Country objects)
    value: the name of the country to find (string)
    returns: the index of the element in the list with the matching value (int)
             or -1 if no matching value was found
    """
Extra Credit Point
Do not attempt this until after you have fully completed the
required parts of this assignment, and run handin21 to submit them.
This is worth an extra credit point if you get it completed. Don’t sacrifice time on the regular required assignment for trying this one; it is not worth it.
First, copy your climate2.py to a file named extracredit.py:
$ cp climate2.py extracredit.py
Open extracredit.py in the code editor and added one or more of the
extensions listed below, or any other you can think of. Add this as
a new menu option (option 6) after option 5 (Quit).
If you add new menu options, add them as additional options to the default assignment (e.g., add new menu options as options 6, 7, …) vs. replacing existing ones. Yes, it will be odd that Quit is 5, and you have menu options that perform actions on the database that come after this, but it will be easier for us to see which options are new extra ones you added.
Here are some suggestions for other things to try out:
1. Graph a Country’s CO2 levels
Implement a function to display a graph of a given country’s CO2 levels for the years 1960, 1980, 2000, 2020, 2022.
Be sure to read the "Features/Hints" part to help you with this one.
Here is some example output from this option:
$ python3 extracredit.py

================== Menu ======================
1. The n largest CO2 producing countries in given year
2. The CO2 values for n countries with largest GDP in given year
3. The n largest CO2/population producing countries in a given year
4. Print a country's info
5. Quit
6. Display a graph of a given country's CO2 levels over years

Select a menu option
Enter a value between 1 and 6: 6
Enter the name of the country: Brazil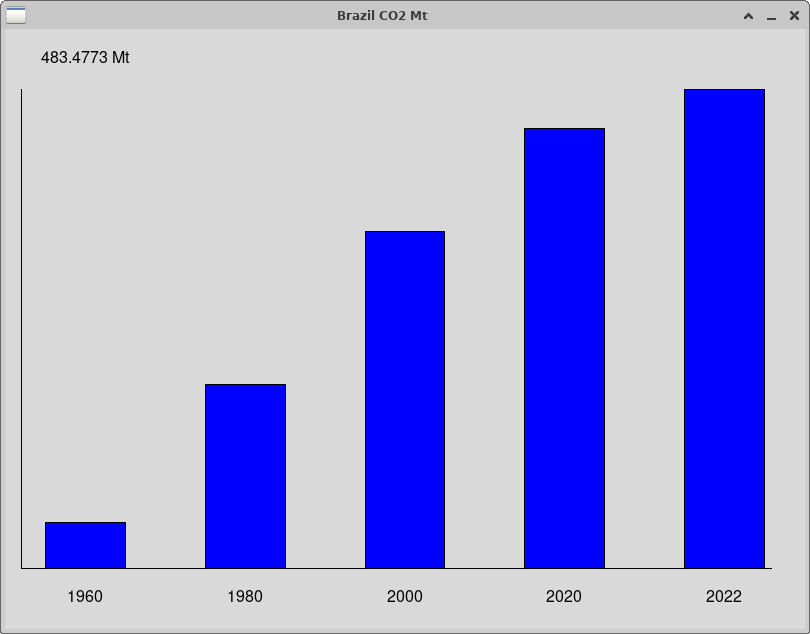
================== Menu ======================
1. The n largest CO2 producing countries in given year
2. The CO2 values for n countries with largest GDP in given year
3. The n largest CO2/population producing countries in a given year
4. Print a country's info
5. Quit
6. Display a graph of a given country's CO2 levels over years

Select a menu option
Enter a value between 1 and 6: 6
Enter the name of the country: United States of America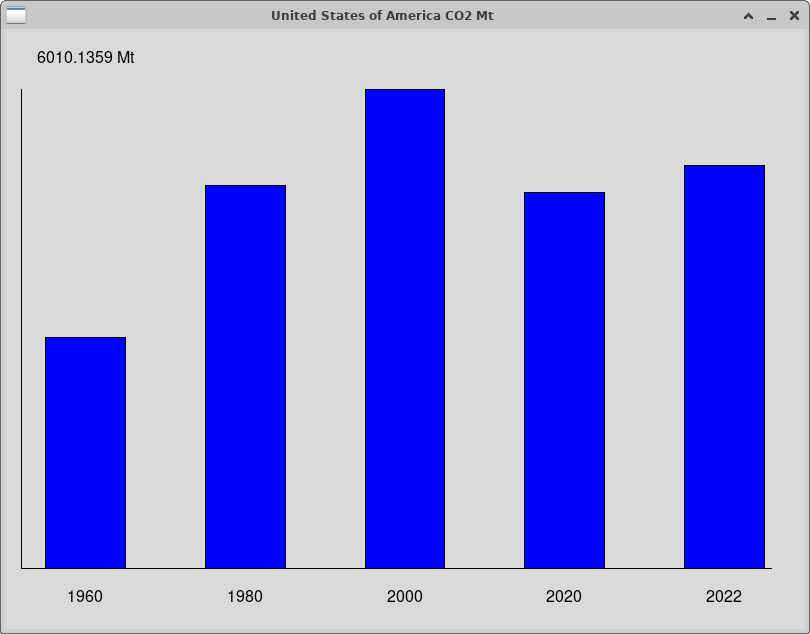
Features/Hints
-
import the Graphics library at the top of your
extra.pyfile:from graphics import *
And remember that you can’t run graphics programs remotely, so you need to be physically logged into a CS lab machine to run this part.
-
Your algorithm to implement this option should first sort the list of Country objects by name. It should then use binary search to find the matching country, and get its CO2 values. If you did not get this working for Lab 8, you can use our version by importing it from our library. See the Hints section for how to do this. See Lab 8 for details of this function definition.
-
You will use the Graphics library to draw the graph. Be sure to use the
getMouse()method ofGraphWinto wait until the user clicks the mouse toclosetheGraphWinobject.-
Create a Rectangular graphics window, where the length (x-axis) is a bit longer than the height. We used
(800, 600)in the one run for the example output. -
The
GraphWinshould be have a title that is the country’s name and"CO2 Mt". -
Use
setCoordsto change the graphics window to have(0,0)in the lower left corner.-
You may want to set the x-axis to go to
5(one unit space for each bar in your graph) or to a value slightly larger than5if you want to use the little extra x-axis space to account for drawing the y-axis on the left. This will make the logic of drawing the graph bars easier. -
You may want to set the y-axis to go to
1(or slightly more than1to account for drawing the x-axis label) at the bottom of the window and space for the max CO2 amount at the top of the y-axis.
-
-
The x-axis should be labeled with the 5 year values.
-
The y-axis should be drawn with a vertical line, and labeled with the largest CO2 value in the country’s set of CO2 values.
-
You should normalize the CO2 values based on the largest value, so that the country’s largest CO2 value is
1.0and the others are less than1.0 -
Do not draw rectangles for any missing data values. You could set these to
0in the normalized data or leave as-1and just skip over then when you draw the rectangle for that year. -
The bars of the graph should be centered over their year label, and there should be space between each bar. See our example as design to follow.
-
-
Use methods of the
Countryclass to access appropriate values from each country’s data: TheCountryClass -
If you did not get binary search working for Lab 8, you can use our version by importing it from our library:
from cs21S24_lab08lib import binary_searchThe function definition is:
def binary_search(data, value): """ performs binary search on a list of Country objects sorted by their names data: list of climate info in increasing sorted order by name (list of Country objects) value: the name of the country to find (string) returns: the index of the element in the list with the matching value (int) or -1 if no matching value was found """ -
Refer to the Country Class Documentation for methods that might be helpful for implementing this menu option.
The
getCO2Valsmethod will be particularly useful for this option.def getCO2Vals(): """ Returns a list of CO2 values for the Country for the years (1960, 1980, 2000, 2020, and 2022) in that order. The caller can modify the returned list. """ -
Refer to Lab 6 Section 2 for some more hints about normalizing data, and for drawing a similar graph (note the different required features for this one).
More Extra Fun
Do not attempt any of these until after you have fully completed the
required parts of this assignment, and run handin21 to submit them.
These are not worth extra credit points, but are some ideas for extra features you can add to your solution if you’d like.
First, copy your climate2.py (or your extracredit.py file) to a
file named morefun.py:
$ cp climate2.py morefun.py
OR
$ cp extracredit.py morefun.py
Open morefun.py in the code editor and added one or more of the extensions
listed below, or any other you can think of. If you add new menu options, add
them as additional options to the default assignment (e.g., add new menu
options as options 7, …) vs. replacing existing ones. Yes, it will be odd
that Quit is 5, and you have menu options that perform actions on the database
that come after this, but it will be easier for us to see which options are new
extra ones you added.
-
A More Efficient Implementation: a more efficient way to design this program is to keep track of the order in which the data are sorted (or keep track of the previous menu option selected). This information can be used by the program to avoid resorting the data when they are already in the correct order for the selected menu option. For example, if the user selects menu option
4ten times in a row, the first time the data need to be sorted by country name, but the next nine times the data do not need to be sorted again (they are already sorted by name). You can change the parameters of your menu option functions to pass the function a value indicating if the data need to be sorted or not before performing the rest of the menu option. -
Other Graph Ideas:
-
Add a new menu option that allows a draws a graph of two countries' data (or for n countries' CO2 data for n up to some small value between 2-4 or 6). The graph should annotate the y-axis with each country’s max CO2 emission value, and use different colored bars to distinguish between each countries' data. You could also add a legend to indicate which country is which color in the graph.
-
Add a new menu option to graph a country’s data each year using a range of color values indicating how that country’s CO2 emission value compares to the median value for that year. For example, you could use a range of green colors for values that are less than the median (lighter green to closer to the median, darker for much more less than), and range of red values for CO2 values that are higher than the median for the year.
-
-
Come Up with Your Own: Come up with another question(s) you want to ask about these climate data. Add a new menu option for it, and implement it. Consider if the data need to be sorted to answer the question, and if, and when, can use binary search vs. linear search.
Answer the Questionnaire
After each lab, please complete the short Google Forms questionnaire. Please select the right lab number (Lab 09) from the dropdown menu on the first question.
Once you’re done with that, you should run handin21 again.
Submitting lab assignments
Remember to run handin21 to turn in your lab files! You may run handin21
as many times as you want. Each time it will turn in any new work. We
recommend running handin21 after you complete each program or after you
complete significant work on any one program.
Logging out
When you’re done working in the lab, you should log out of the computer you’re using.
First quit any applications you are running, including your vscode editor, the browser and the
terminal. Then click on the logout icon ( or
or
 ) and choose "log out".
If you plan to leave the lab for just a few minutes, you do not need to log
out. It is, however, a good idea to lock your machine while you are gone. You
can lock your screen by clicking on the lock  icon.
PLEASE do not leave a session locked for a long period of time. Power may go
out, someone might reboot the machine, etc. You don’t want to lose any work!
icon.
PLEASE do not leave a session locked for a long period of time. Power may go
out, someone might reboot the machine, etc. You don’t want to lose any work!