CS21 Lab 6: Functions and Lists
Due Saturday, March 9, by 11:59pm
Goals
The goals for this lab assignment are:
-
Learn to use lists
-
Understand how functions operate on lists
-
Get more practice with the Graphics Library
-
Get more practice writing functions
-
See how small functions can be assembled into a larger program
Getting and Working on Lab06 Code
Make sure you are working in the correct directory when you edit and run lab 06 files.
Run update21 to get the starting point code of the next lab assignment.
This will create a new ~/cs21/labs/06 directory for your lab work.
Edit and run Lab 06 programs from within your cs21/labs/06
directory.
Make sure all programs are saved to your cs21/labs/06
directory! Files outside that directory will not be graded.
$ update21
$ cd ~/cs21/labs/06
$ pwd
/home/username/cs21/labs/06
$ ls
(should see your program files here)
Then edit and run program files in your ~/cs21/labs/06 directory:
$ code filename.py
$ python3 filename.py
Writing Functions
As you will be writing numerous functions in this lab, please be sure to review the following tips before you begin.
As you write programs, use good programming practices:
-
Use a comment at the top of the file to describe the purpose of the program (see example).
-
All programs should have a
main()function (see example). -
Use variable names that describe the contents of the variables.
-
Write your programs incrementally and test them as you go. This is really crucial to success: don’t write lots of code and then test it all at once! Write a little code, make sure it works, then add some more and test it again.
-
Don’t assume that if your program passes the sample tests we provide that it is completely correct. Come up with your own test cases and verify that the program is producing the right output on them.
-
Avoid writing any lines of code that exceed 80 columns.
-
Always work in a terminal window that is 80 characters wide (resize it to be this wide)
-
In
vscode, at the bottom right in the window, there is an indication of both the line and the column of the cursor.
-
Function Comments
All functions should have a top-level comment! Please see our function example page if you are confused about writing function comments.
Overview: Drawing a Histogram
Computational Linguistics is an interdisciplinary field that applies concepts from the field of computer science, math, and logic to solving problems related to and getting an understanding of linguistics and natural (or "human") languages.
This field includes such tasks as speech recognition, machine translation, text summarization, and social media mining, among many others.
In many cases, problems in computational linguistics involve taking a large input, e.g. a text document or audio clip, and breaking it into smaller, individual components. These individual components can then be visualized using a histogram, which is a graphical display of data using vertical bars ("towers") of different heights, typically to show the distribution of values in some range. For instance, a histogram can be used to visualize the frequency or number of occurrences of certain words, individual letters, or combinations of letters within a certain document.
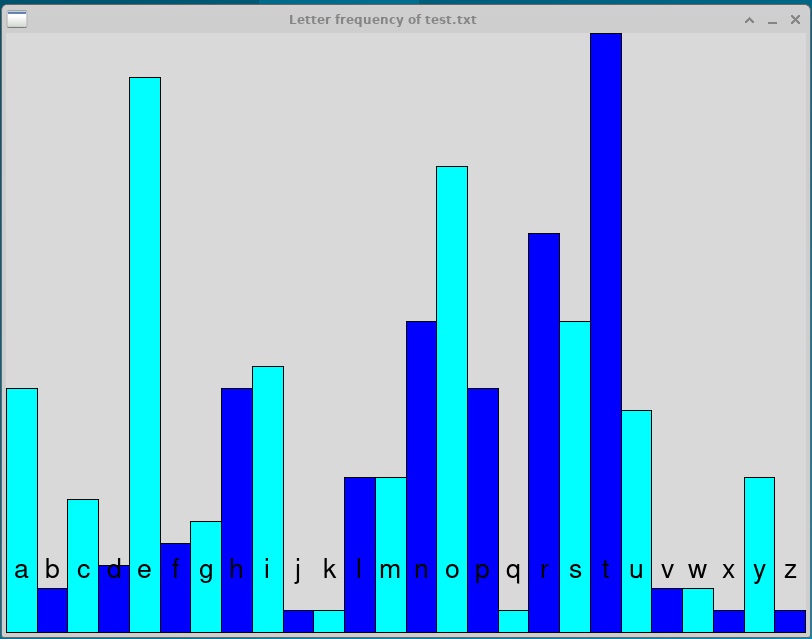
In this assignment, you will write functions that comprise a program that displays a histogram of the number of occurrences of letters in a piece of text. The histogram that your program produces will look something like this:
Be sure that you implement the functions described here in the order that they are presented, and that you test each one before proceeding. Note that it is not sufficient to simply write a program that generates the histogram, but rather you are expected to implement the functions as described below.
Getting Started
The histogram.py file that we have provided includes code in main() to read from a text file and create a list in which each element contains a string representing one line of the file.
Before you begin, make sure that your program is able to read the file "test.txt", which should be in the same directory as your Python program; you should see the following output (user input is in bold):
$ python3 histogram.py

Enter the name of the file: test.txt

['use this file for testing your program\n', 'BE SURE YOUR PROGRAM CONVERTS UPPER CASE LETTERS TO lower case \n', 'And that you ignore punctuation!?!@#<3\n', 'The quick brown fox jumps over the lazy dog\n', 'python python python\n', 'hint! The letter t is the most common letter in this file and appears 27 times!']
If you see something like FileNotFoundError: [Errno 2] No such file or directory: 'test.txt' then it may be the case that you did not run update21 or that you are not running python3 from your ~cs21/labs/06 directory. Be sure your directory contains test.txt.
1. Counting Letters
In order to start implementing this program, we need some code that will count the number of occurrences of each letter in the input file. Write and test the following functions in the order described here. Be sure that all of these are working correctly before moving to the next part of the assignment!
1.1. initialize(n)
First, we need a helper function that will give us a list that consists of all zeroes.
Write the initialize(n) function using the prototype below.
This function should return a list consisting of n zeroes, and can assume that n is a positive int.
def initialize(n):
    """
    Create and initialize a list.

    n: (int) number of elements in the list; assumed to be positive.

    returns: (list) list consisting of n zeroes.
    """
To test this function:
-
Add the line
count = initialize(10)to yourmain()function, and then callprint(count). -
When you run your program, you should see it print a list of 10 zeroes, i.e.
[0, 0, 0, 0, 0, 0, 0, 0, 0, 0]
1.2. count_letters(line)
Next, we need a function that will count the number of occurrences of each character in a line of the input file.
Write the count_letters(line) function using the prototype below.
This function should return a 26-element list in which the first element (index #0) holds the number of occurrences of the letter "a" in line, the second element (index #1) holds the number of occurrences of the letter "b", and so on.
def count_letters(line):
    """
    Count the number of occurrences of each letter in the line of text.

    line: (str) line of text from the input file.

    returns: (list) 26 element list of ints in which each element holds the
    number of occurrences of the corresponding letter.
    """
This function should be "case-insensitive", meaning that it should treat the letters "A" and "a" as the same, and combine their number of occurrences into a single value.
Hint!
To simplify this, you can call line.lower() to covert all the letters in line to lowercase.
Note that this returns a new string and does not modify line.
Also, this function should ignore characters that are not letters in the English alphabet, and should only count the number of occurrences of characters between "a" and "z".
Hint!
Recall that it is possible to compare strings using the comparison operators such as >, >=, <, etc.
Use these to determine whether each character in the line is between "a" and "z".
In counting the number of occurrences of each letter, don’t you dare write a 26-line if-statement! Rather, use the ASCII values of the letters to determine the index in the list that is tracking the number of occurrences of that letter so that index #0 tracks the number of "a"s, index #1 tracks the number of "b"s, etc.
Here are some hints!
-
You can call
ord('a')to get the ASCII value of the letter "a" as an int. -
The ASCII value of "b" is one larger than that of "a"; the ASCII value of "c" is two larger than that of "a"; the ASCII value of "d" is three larger than that of "a"; and so on.
-
Thus,
ord('c') - ord('a')will generate 2, which not coincidentally is the index for the letter "c".
As a last hint, use the initialize function that you previously wrote to create a 26-element list of all zeroes, and then update it as you iterate through the characters in line.
To test this function:
-
Add the line
letter_count = count_letters("abc ABC z!")to yourmain()function, and then callprint(letter_count). -
When you run the program, you should see a list that starts
[2, 2, 2,followed by 22 zeroes, and then, 1]at the end.
1.3. merge(lst1, lst2)
The count_letters(line) function above only counts the letters in a single line of text, but we need to accumulate these values for the entire input file.
In order to do this, write the merge(total, update) function using the prototype below.
This function merges the values in the lists total and update by increasing each element in total by its corresponding element in update, i.e. after the function is executed element #n of total equals the original value of total[n] plus update[n].
def merge(total, update):
    """
    Merge the two lists by adding their corresponding elements and updating
    the total list.

    total: (list) a list of ints.

    update: (list) another list of ints.

    returns: none; the total list should be modified as a result of calling
    this function.
    """
Your function can assume that total and update have the same number of elements and that all elements are ints.
However, you should not assume that they each consist of 26 elements: your function should work correctly for lists of any length.
Note that this function has no return value, but rather should modify the total list; the update list should not be modified.
To test this function:
-
Add code to your
main()function to create a list calledtempthat is set to[1, 2, 3]. -
Then call the
mergefunction withtempas the first input/argument and the list[5, 6, 7]as the second. -
Then call
print(temp). -
When you run your program, you should see
[6, 8, 10].
1.4. Integrating Your Code
Remove your test code from main() (being careful not to remove the provided code that reads the text file!) and then begin implementing the rest of the main() function as follows:
-
After reading the text file, use the
initializefunction to create a list of 26 zeroes; this will be the list that keeps track of the count of letters in the entire file. -
Then, loop over all the elements in the list called
lines: each one represents a line of the text file. -
Inside the loop, use the
count_lettersfunction to count the letters in the line, and then use themergefunction to update the list that is keeping track of the count of letters in the entire file (Note that this is an example of the accumulator pattern! Here, though, we’re using an entire list as the accumulator variable). -
Once the loop ends, print the list that is keeping track of the count of letters in the file.
-
The list that is displayed should contain 26 elements and indicate that the letter "a" appears 11 times in test.txt, in addition to showing the correct counts for the other 25 letters.
2. Scaling Values
In order to draw our histogram, we need to calculate the relative number of occurrences of each letter, so that the most common letter has a relative value of 1.0, and the other letters' values equal the relative percentage of that value.
For instance, if "s" is most common letter, then it should have a value of 1.0; if there are 75% as many "e"s, then the value of "e" should be 0.75. This will help us draw our histogram so that the most common letter has a tower that takes up the entire height of the window, and all other letters' towers are drawn relative to that.
Write and test the following functions in the order described here. Be sure that these are working correctly before moving to the next part of the assignment!
2.1. find_max(lst)
We first need to figure out which letter occurs the most, i.e. what is the largest value in the list that tracks the number of occurrences.
Write a function named find_max as follows:
-
The parameter should be a list named
lst. -
The function should return the largest value in the list, which you can assume consists only of ints.
Be sure to write a function comment as part of your function definition. The comment should describe the purpose of the function, its parameter, and its return value, as in the examples above.
As with your merge function above, your find_max function should not assume that the input list consists of 26 elements, but rather should work with lists of any length.
To test this function:
-
Add code to your
main()function that calls this function with a list of ints, then print out the return value. -
When you run the program, it should display the largest value from the list.
2.2. normalize(lst)
Now we need a function that will scale (or "normalize") the values in our list by converting the largest value to 1.0 and then modifying the others so that they store the relative percentage of that value (as floats). We do this by finding the largest value in the list and then dividing all elements by that value.
Write a function named normalize as follows:
-
The parameter should be a list named
lst. -
The return value should be a list of floats in which all of the values in
lstare divided by the largest value inlst.
Be sure to write a function comment as part of your function definition. The comment should describe the purpose of the function, its parameter, and its return value, as in the examples above.
Use the find_max function above to find the maximum value in the list, i.e. do not duplicate that code here.
Your function should not modify lst, but rather should return a new list consisting of the scaled/normalized values as floats.
Your normalize function can assume that the list consists only of ints, but should not assume that there are 26 elements: as above, your function should work with lists with any number of elements.
To test this function:
-
Add code to your
main()function that calls this function with a list of ints, e.g.[1, 2, 3, 4], then print out the return value. -
When you run the program, it should display a list containing the same number of elements, but with each divided by the largest value, e.g.
[0.25, 0.5, 0.75, 1.0].
2.3. Integrating Your Code
-
First remove the test code you wrote for the
find_maxandnormalizefunction. -
Then modify your
main()function so that the list from Part 1 (containing the count of letters in the file) is passed to thenormalizefunction. -
Then print the resulting list. The list that is displayed should contain 26 elements and indicate that the letter "a" has a relative percentage of 0.4074.
3. Drawing Rectangles
Now that we know the relative number of occurrences of each letter, we can use the Zelle graphics library to draw our histogram.
Write and test the following functions in the order described here. Once you’ve finished these, you’re done with your program!
3.1. Using set_coords
In order to make drawing the graphics a bit easier, add the following code to your main() function:
    window = GraphWin("Letter frequency of " + name, 800, 600)
    window.setCoords(0, 0, 26, 1)
This will create the graphics window and set the coordinates such that:
-
The lower-left corner is at coordinate (0, 0)
-
The upper-right corner is at coordinate (26, 1)
-
This means that the x-axis goes from 0 to 26
-
And the y-axis goes from 0 to 1
Use this information as you implement the next two functions!
3.2. draw_one_rectangle(window, index, size)
Our histogram will consist of 26 towers (rectangles), one for each letter. The location of the tower will depend on which letter of the alphabet it is, and the size/height will depend on its relative number of occurrences.
Write the draw_one_rectangle(window, index, size) function using the prototype below.
def draw_one_rectangle(window, index, size):
    """
    Draw a rectangle in the window for the corresponding letter based on its
    relative number of occurrences.

    window: (GraphWin) the window in which the rectangle should be drawn

    index: (int) the 0-based index of the letter for which this function is
    drawing the rectangle, e.g. 0 = "a", 1 = "b", etc.

    size: (float) the relative number of occurrences of the letter, with 1.0
    being the most common letter.

    returns: none
    """
The most challenging aspect of this function is figuring out the locations of the two Points (top-left and bottom-right) that are needed two draw the Rectangle in the right place.
Keep in mind that, since your main() function calls window.setCoords(0, 0, 26, 1), the x-axis goes from 0 to 26 and the y-axis goes from 0 to 1.
Here are some more hints to help you draw the Rectangles:
-
The
indexis used to determine the x-axis coordinates of the left and right sides of the Rectangle. -
The tower for "a" (
index= 0) has its left side at 0 on the x-axis and its right side at 1; the tower for "b" (index= 1) has its left side at 1 on the x-axis and its right side at 2; and so on. -
The
sizeis used to determine the y-axis coordinates of the top and bottom sides of the Rectangle. -
The tower for the letter that occurs the most (
size= 1.0) has its top at 1 on the y-axis, i.e. at the top of the window. A tower for a letter withsize= 0 would have its top at 0 on the y-axis, i.e. at the bottom of the window. The towers for other letters have their tops at y-coordinates between 0 and 1, depending on theirsize. -
Regardless of the
size, the bottoms of all towers are at the bottom of the window.
The draw_one_rectangle function should ensure that the towers of the histogram appear in alternating colors as in the image above.
You can select any colors you like, and do not need to limit yourself to two, but must be sure that neighboring towers are of different colors.
To test this function:
-
Add code to
main()so that you iterate over the elements in the list of relative frequencies from Part 2 and, for each iteration, calldraw_one_rectanglewith the arguments beingwindow, the element’s index, and the corresponding value in the list. -
Also add the line
window.getMouse()at the end so that the window will stay open until you click the mouse. -
Your program should be generating an image similar to the one below (perhaps with different colors), except for the letters along the bottom.
3.3. draw_labels
To finish our histogram, we need to add the labels to each tower so that the corresponding letters appear in the image.
Write a function named draw_labels that draws all 26 letters in this histogram, with each one appearing in the center (horizontally) of the corresponding tower, and all lined up vertically near the bottom of the image.
Be sure to write a function comment as part of your function definition. Think about the parameters and/or return values for this function, and be sure to mention them in the comment, along with a description of the function.
You should use a Text object to display each letter, and a Point object to determine its location.
Here are some hints that will help you figure out where each letter should be displayed:
-
The x-coordinate of each letter should be halfway between the left and right sides of the Rectangle for that letter’s tower. Review your solution to the
draw_one_rectanglefunction to determine how to calculate the x-coordinate based on the index of the letter. -
To ensure that the letters are lined up vertically slightly above the bottom of the image, each should have the same y-coordinate; keep in mind that the bottom of the window has a y-coordinate of 0.
Use the setSize method on the Text object to change its size; you may choose any size that you think is reasonable.
Keep in mind that your function is drawing the labels for all 26 letters, not just one. Your function will need to include a loop that is used to generate the 26 letters to appear in the histogram.
Use these hints to figure out how to generate each letter based on a sequence of ints:
-
You can call
ord('a')to get the ASCII value of the letter "a" as an int. -
The ASCII value of "b" is one larger than that of "a"; the ASCII value of "c" is two larger than that of "a"; the ASCII value of "d" is three larger than that of "a"; and so on.
-
You can use the
chr(value)function to convert an int ASCIIvalueto its corresponding letter. For instance,chr(ord('a') + 2)will generate the character "c".
To test this function:
-
Call the
draw_labelsfunction from yourmain()function, passing any argument(s) that you think it needs. Be sure to place it before the call towindow.getMouse(). -
You should see your completed histogram!
Congratulations on finishing the assignment! Have a safe and healthy Spring Break!
4. Just For Fun!
Once you have completed the assignment and submitted your code using handin21, you may optionally perform the following task. This is not worth any extra credit points, but demonstrates an application of the histogram that you have created.
We have made three other input files available on the lab computers:
-
/usr/local/doc/alice.txt, which contains the text for Lewis Carroll’s Alice’s Adventures in Wonderland -
/usr/local/doc/gadsby.txt, which contains the text for Ernest Vincent Wright’s Gadsby -
/usr/local/doc/war.txt, which containis the text for Leo Tolstoy’s War and Peace
Use your solution to this lab to generate histograms for these three files and compare the results. To see all three histograms simulataneously, you may need to open three Terminal windows and navigate to the ~cs21/labs/06 directory and run the program with a different input file in each Terminal.
Based on the comparison, what interesting result do you notice about the histogram for Gadsby?
5. Answer the Questionnaire
After each lab, please complete the short Google Forms questionnaire. Please select the right lab number (Lab 06) from the dropdown menu on the first question.
Once you’re done with that, you should run handin21 again.
Submitting lab assignments
Remember to run handin21 to turn in your lab files! You may run handin21
as many times as you want. Each time it will turn in any new work. We
recommend running handin21 after you complete each program or after you
complete significant work on any one program.
Logging out
When you’re done working in the lab, you should log out of the computer you’re using.
First quit any applications you are running, including your vscode editor, the browser and the
terminal. Then click on the logout icon ( or
or
 ) and choose "log out".
If you plan to leave the lab for just a few minutes, you do not need to log
out. It is, however, a good idea to lock your machine while you are gone. You
can lock your screen by clicking on the lock  icon.
PLEASE do not leave a session locked for a long period of time. Power may go
out, someone might reboot the machine, etc. You don’t want to lose any work!
icon.
PLEASE do not leave a session locked for a long period of time. Power may go
out, someone might reboot the machine, etc. You don’t want to lose any work!