1. Goals for this week:
-
See the different parts of memory in an example program.
-
Practice debugging C programs with pointer variables using gdb.
-
Practice C’s
stdiosupport for File I/O. -
Learn debugging memory errors using valgrind.
-
Introduction to Lab 4.
2. Starting Point Code
Start by creating a week05 in your cs31/WeeklyLabs
subdirectory and copying over some files:
$ cd ~/cs31/WeeklyLabs
$ mkdir week05
$ cd week05
$ pwd
/home/you/cs31/WeeklyLabs/week05
$ cp ~newhall/public/cs31/week05/* ./
$ ls
Makefile	  badprog.c    memparts.c	   students.txt
README		  fileio.c     segfaulter.c	   students2.txt
allocate_array.c  functions.c  simple_valtester.c  valtester.c
3. Parts of Memory
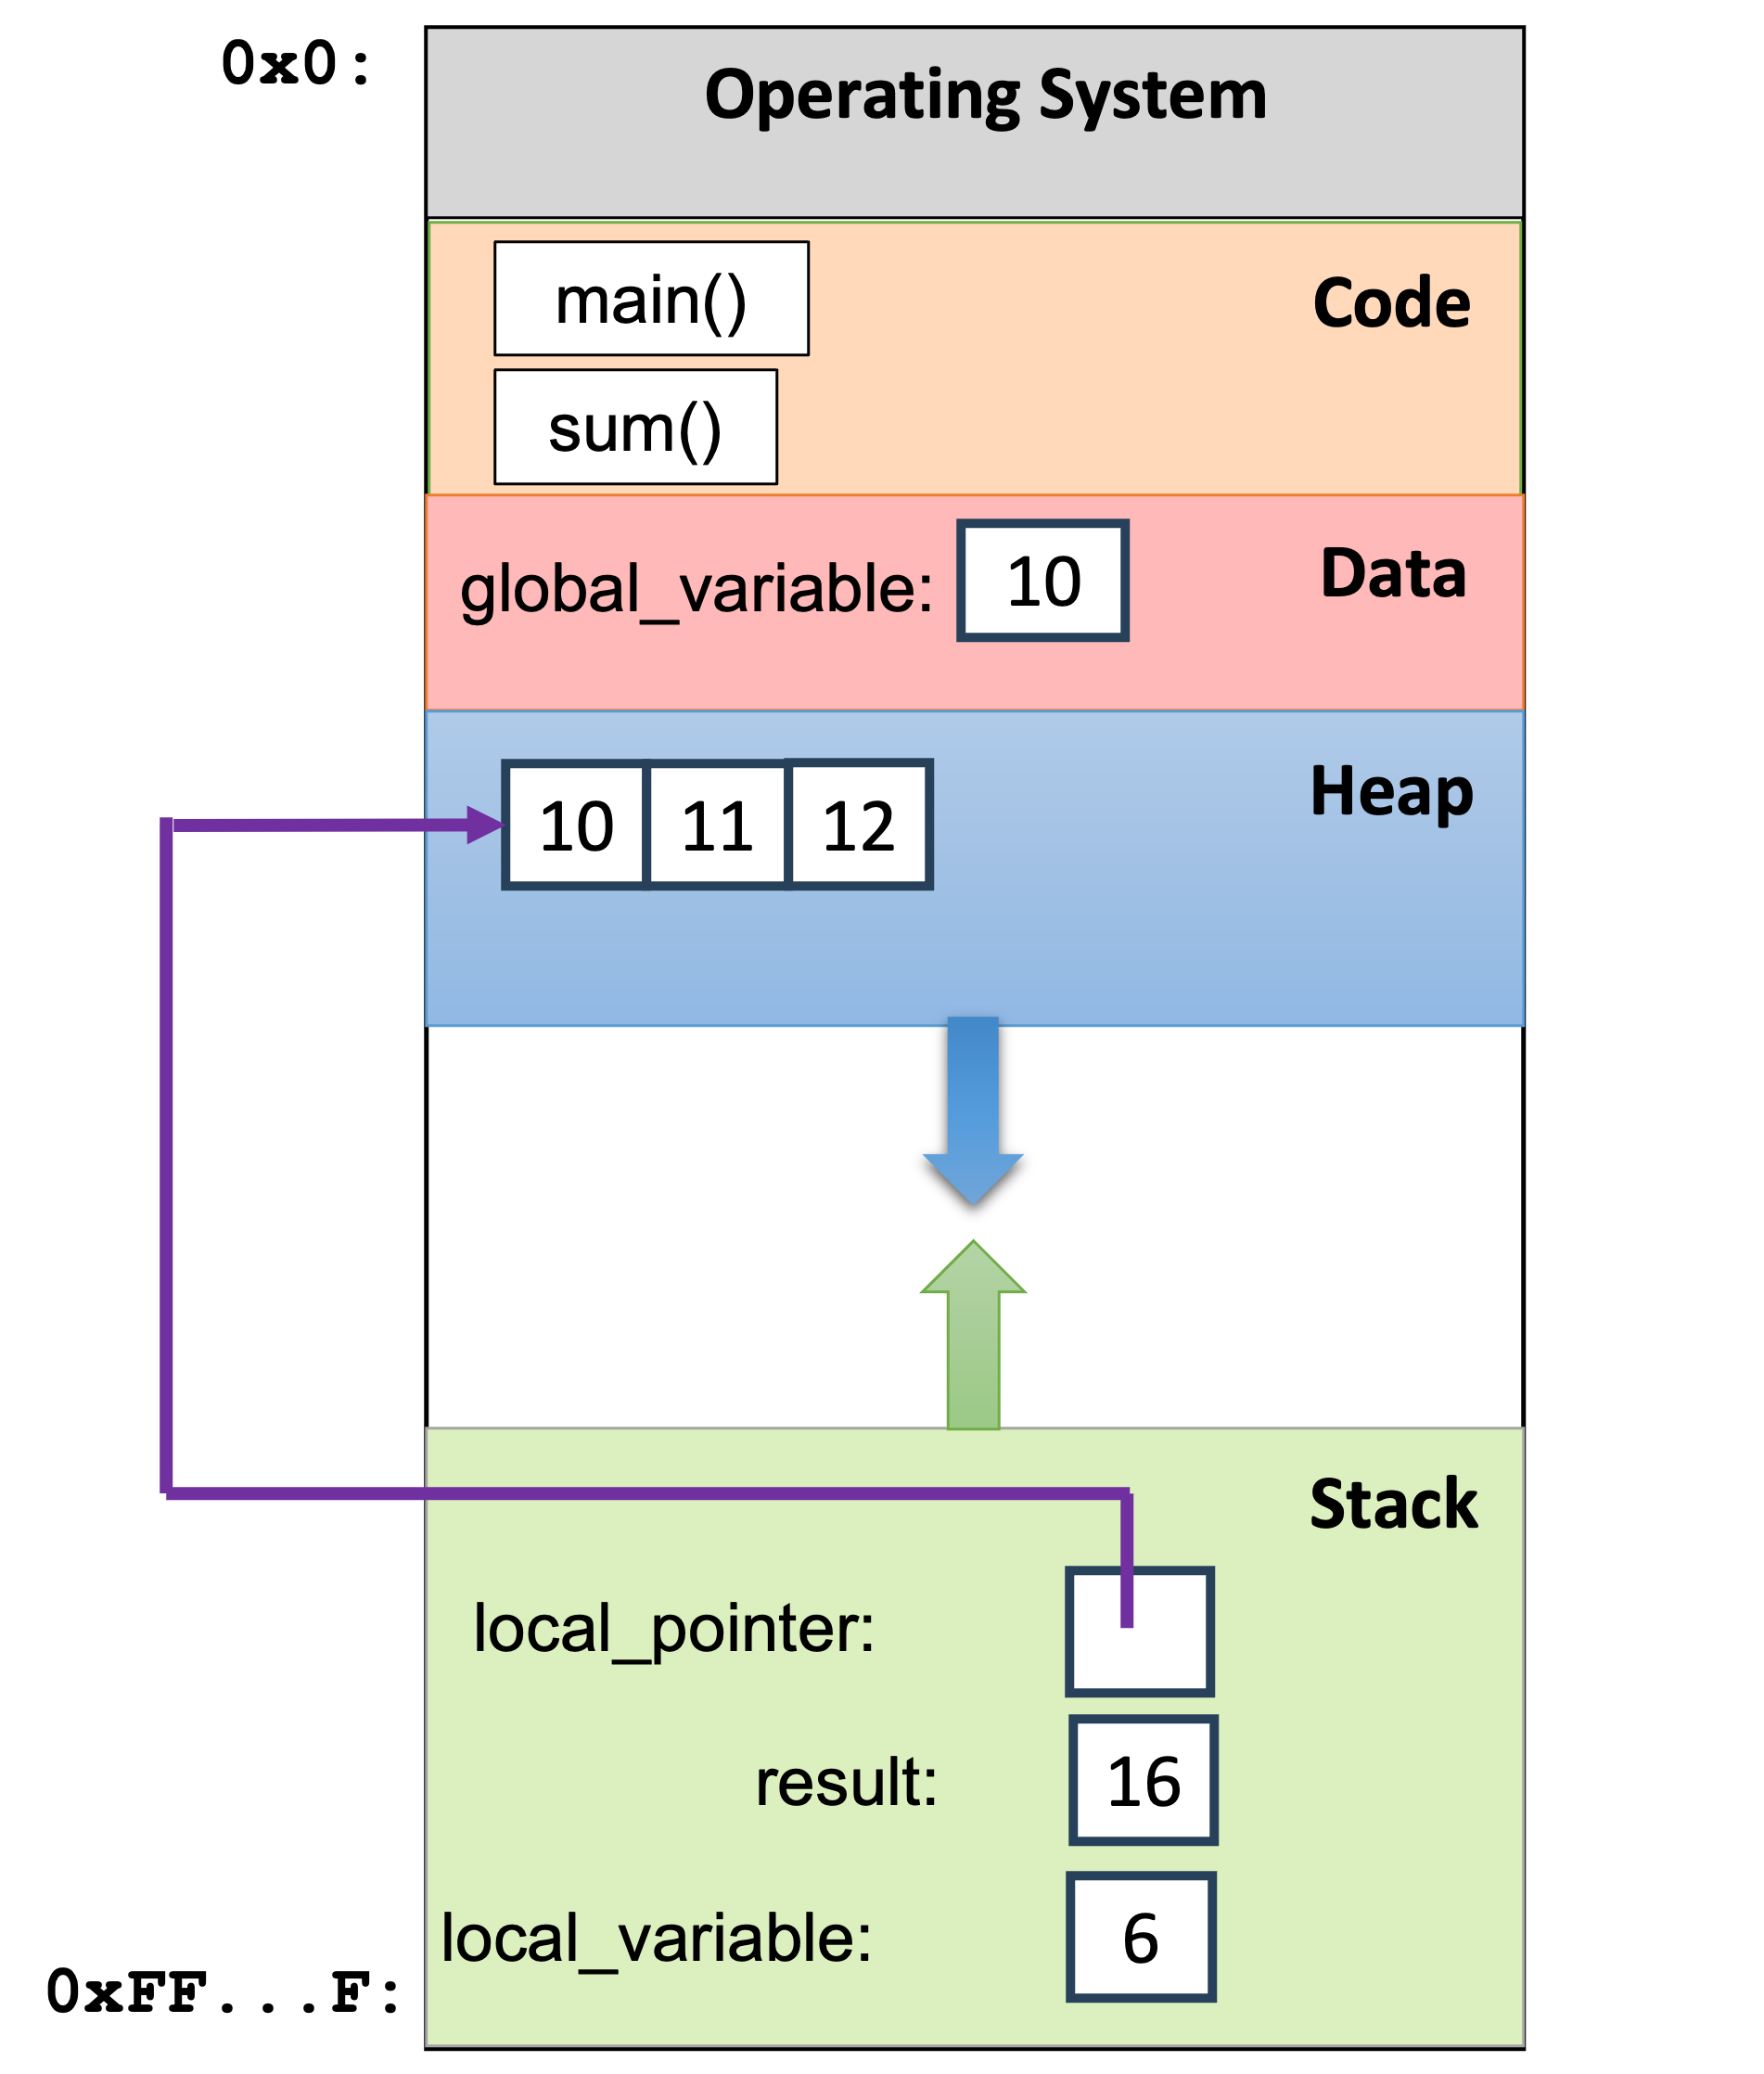
Let’s start by briefly looking at memparts.c. This program prints out
the memory address of different parts of the program: global variables
are allocated
in the Data part; local variables are allocated on the Stack; instructions
are in the Code part; and malloc’ed memory is allocated in the Heap.
Let’s run this code and see where some things are:
$ make
$ ./memparts
Note that heap memory locations (malloc’ed space in the Heap) and local variable locations (on the Stack) are at very different addresses. Here is a picture of program memory near the end of the program:
4. File I/O in C
For the next lab assignment you will use the C stdio library interface for
doing file I/O. This interface include the functions fopen, fclose, and
fscanf.
In fileio.c is an example program that uses this interface.
Open fileio.c in an editor and let’s see what it is doing.
$ vim fileio.cThis program, when run, takes as input a file. In another terminal, you can
cat out the contents of an example input file, students.txt to see its
format and contents:
$ cat students.txtNote, you can also run wc to see the number of lines, words, and bytes
in each input file:
$ wc students.txt
$ wc students2.txt
And then let’s try running this program with an input file command line argument to to see what it does (note that it does the same thing with two different sized input files):
$ ./fileio students.txt
$ ./fileio students2.txt
Now, let’s take a closer look at some of the C File I/O functions:
fopen: open a file
To open a file, make a call to fopen passing in the file name string
and the mode to open it in ("r" for read). fopen returns a
FILE * that is used to refer to the open file. Remember that a
FILE * is not a pointer like pointers to other C types:
dereferencing it doesn’t make any sense.
Here is an example call to fopen (assume filename is a
char * that has been initialized to the file name):
FILE * fileptr; // declare a file pointer

fileptr = fopen(filename, "r"); // open the file in read mode
if (fileptr == NULL) { // check if there was an error opening the file
    printf("Error: failed to open file: %s\n", filename);
    exit(1);
}
fscanf: read values from a file
To read in values, use fscanf, which is similar to scanf but
for reading in values from files.
fscanf takes three arguments:
1. a FILE * that points to the file that you opened and will read from,
2. a format string specifier (e.g., "%d" for an integer or "%f" for a
float)
3. an address of where to store the value(s) read in.
fscanf returns the number of items read in, or EOF if the end of
the file is reached (EOF is a value you can test for in your program),
or it return 0 if there was an error.
Here is an example call to fscanf:
float read_in;

// read in a float and store it in read_in
ret = fscanf(fileptr, "%f", &read_in);

// check for error or EOF return values and handle
// appropriately before using value of read_in
fclose: clost a file
When you’re done reading from the file, you should close it by calling
the fclose() function:
ret = fclose(fileptr); // close the fileLook at the man page for fscanf, fopen, and fclose, and
see <handyhandy> for other C programming references.
You can find more extensive documentation about file I/O in C in the Chapter 2 of the textbook.
5. Arrays and Functions
We are going to quickly step through this together, but we recommend you revisit this on your own as it uses arrays and functions in a similar way as you will in the next lab assignment.
The allocate_array.c program demonstrates how to use pass-by-pointer
parameter so that a function can modify its argument’s value,
how how to return a pointer from a function, and how to use
malloc and free to allocate heap memory for an array.
Trace through this program, drawing the stack and the heap as the program executes.
Here are the important takeaways:
-
In
main, we pass the memory address ofarray_sizeto theallocate_arrayfunction. This allows theallocate_arrayfunction to modify thearray_sizevariable that is in the stack frame ofmain. -
The
allocate_arrayfunction usesmallocto allocate enough space on the heap to holdvalintegers and then returns the memory address of the start of this block of memory. We save this memory address in the variablearray. -
It’s good practice to check to make sure that the call to
mallocsucceeded. If themallocfunction returnsNULL, it means that heap memory was not allocated because, e.g. there was no memory left to be allocated. -
The return type of the
allocate_arrayfunction isint *. This allows us to return the memory address of the allocated heap memory back tomain. -
In
main, we can access dynamically allocated memory through a pointer similar to how we would access a statically allocated array, e.g., array[1]. A statically allocated array is one that was declared like this, e.g.:int array[10];while a dynamically allocated array is declared like this:int *array = malloc(10 * sizeof(int));. -
When we are done using the heap-allocated memory, we need to
freeit.
6. Debugging C programs using gdb
We introduced gdb in In-Lab 2 (intro gdb). This week, we will briefly revisit some of the basics of using gdb, and then take a closer look at using gdb to examine the stack and to examine function calls with pass-by-pointer parameters.
6.1. common gdb commands
We will not go through this together, but as a good reminder of
some of the commonly used gdb commands that we covered
in In-Lab 2 (intro gdb),
you can try running gdb on
the badprog program, and follow along with a debugging
session of it from the gdb guide:
badprog example.
The course textbook Section 3.1 also contains similar examples, and
Section
3.2 discusses gdb commands in more detail.
6.2. examining stack contents
We will start by opening up functions.c and looking at the code:
$ vim functions.cThis program contains a lot of functions, and we will use it to
see gdb’s support for examining the state of the program stack. Let’s
run in gdb, and set breakpoints in some of the functions, and run
until the breakpoint in function g is reached:
$ make
$ gdb ./functions
(gdb) break main     # break at main
(gdb) break g
(gdb) run
(gdb) where          # list stack at break point in main
(gdb) cont
(gdb) where          # list stack at break point in g
At this point we can print out local variables and parameters in the
stack from of function g (the function on the top of the stack).
We can also move into the context of a different frame on the stack
and examine its local variables and parameters.
Of particular note is the print command that lets us print addresses
of variables using the & operator: print &x, and it also lets us
dereference pointers using the * operator: print *y.
(gdb) where             # list stack at break point in g
#0  g (x=41) at functions.c:15
#1  0x00005555555546a2 in f (y=40) at functions.c:23
#2  0x00005555555546ff in blah (y=0x7fffffffe2bc) at functions.c:33
#3  0x0000555555554748 in foo (x=40) at functions.c:40
#4  0x00005555555547a4 in main (argc=1, argv=0x7fffffffe3d8) at functions.c:53
(gdb) list
(gdb) print x           # prints out function g's x
(gdb) frame 3           # move into foo's stack frame
(gdb) list
(gdb) print x           # print out foo's x variable value
(gdb) print &x          # print out the address of foo's x
(gdb) frame 2           # move into stack frame 2's context (blah)
(gdb) list
(gdb) print y           # print value of blah's y parameter
(gdb) print *y          # print value of what blah's y parameter points to
(gdb) where             # we are still at the same point in execution
(gdb) cont
6.3. finding where program segfaults
Next, let’s run segfaulter.
$ ./segfaulter
Segmentation fault (core dumped)
We are going to follow the example in the textbook to see how to find where a program segfaults in order to help determine the cause of the segfault and fix it: segfaulter example in 3.1.2.
6.4. conditional breakpoints
We will not go over
this but, conditions can also be added to breakpoints so that
that the breakpoint is hit only when the condition is true.
Conditional breakpoints are useful if the buggy behavior only happens
on certain conditions. For example, it may only happen after the
1,000th iteration of a loop. In this case, a conditional breakpoint
can be set on the loop counter variable to only break when the loop
counter’s value is greater than or equal to 1000. See the comment at
the top of the file for how to do this. And for more information,
see the infomaation about condition in the
Commands
for Setting and Manipulating Breakpoints in section 3.2 of
the textbook.
7. Debugging C programs using Valgrind
Next, we will use the simple_valtester.c program to demo Valgrind.
Valgrind is a tool for finding memory access errors in programs.
Memory errors are the most difficult bugs to find in programs.
When debugging programs that use pointer variables to access
dynamically allocated heap memory space (malloc and free memory),
using Valgrind can save you hours of debugging time.
Try running simple_valtester. It runs to completion seemingly fine (
although gcc did provide some warnings when compiling it).
$ ./simple_valtester
0
1
2
3
4
5
0
1
2
3
4
5
a = 32764
Now let’s run valgrind on this program, and we will see that there are
a number of memory access errors that valgrind finds that look like the
following:
$ valgrind ./simple_valtester
...
==377== Invalid write of size 4
==377==    at 0x1091CA: main (simple_valtester.c:21)
==377==  Address 0x4a9d054 is 0 bytes after a block of size 20 alloc'd
==377==    at 0x4846828: malloc (in /usr/libexec/valgrind/vgpreload_memcheck-amd64-linux.so)
==377==    by 0x1091A5: main (simple_valtester.c:18)
==377==
==377== Invalid read of size 4
==377==    at 0x1091E0: main (simple_valtester.c:22)
==377==  Address 0x4a9d054 is 0 bytes after a block of size 20 alloc'd
==377==    at 0x4846828: malloc (in /usr/libexec/valgrind/vgpreload_memcheck-amd64-linux.so)
==377==    by 0x1091A5: main (simple_valtester.c:18)
==377==
...
(Note: the ==377== prefix is the process identifier of the running program
and it will differ from one run of the program to the next).
Some example memory errors that valgrind finds include, but are not limited to:
-
Accessing unallocated memory locations (read/get a value, or write/set a value). Often times, but not exclusively, these errors are from accesses beyond the bounds of a statically allocated array on the stack or of a dynamically allocated array on the heap.
-
Using the value of initialized memory.
-
Accessing heap memory locations after they have been freed.
-
Memory leaks: losing all references to allocated heap memory (no program variable stores its address, so your program can no longer free this space).
Of these, memory leaks are by far the least serious. You still should fix them, but focus your efforts on the other errors first.
Let’s look at some of valgrind errors from running simple_valtster together and see
valgrind is telling us about each of the program’s memory access errors,
and how we might use this to fix them. Often times using valgrind and
gdb together are useful for determining how to fix a memory bug that
valgrind finds.
For a more detailed look at using Valgrind, follow along
with the example from the
valgrind
guide using the valtester.c program,
Chapter 3.3 of the textbook
also covers valgrind.
8. Lab 4 Intro
Let’s look at Lab 4, and then you can use the remaining time to get started. The lab consists of a C programming assignment using pointers, and remember this page with information on using gdb and valgrind to debug your C programs.
9. Handy Resources
-
C programming
-
C debugging
-
Chapter 3 on gdb and valgrind
-
Unix