Professor Tia Newhall
Swarthmore Women in Computer Science
(W+iCS) Lunch Talk
Nov 4, 2019
Welcome! Log in, and Grab Some Example Programs
Please login (or sit with a friend who is logged in), and then copy over a directory containing some example programs that we will debug using gdb and valgrind.
Copy /home/newhall/public/Debugging into your home directory:
cd
cp -r /home/newhall/public/Debugging .
cd Debugging/
ls
make
GDB and Valgrind

Today we are going to talk about debugging tools that many of you have used before in CS 31 / CS 35 (the GNU GDB debugger in particular, but also a quick peek at valgrind). If you have not yet programmed in C or C++, the pdb Python debugger has similar functionality to GDB (and almost identical command syntax as gdb). I’m not going to talk about pdb today, but the References and Links section has more information about debugging tools (gdb, valgrind, and pdb).
-
The GNU Debugger (GDB) allows you to pause a running program and inspect its state.
-
Valgrind’s memcheck monitors a program’s memory accesses and prints warnings if the program accesses invalid locations or attempts to read values that the program never set (initialized).
Both of these tools are extremely useful, and you’re probably not using them enough. In particular, you should NOT leave Valgrind as an afterthought! GDB and Valgrind should be part of your incremental implementation and testing as you implement course lab assignments and larger project code.
They both have lots of options and functionality. Today, we’re going to focus on the basics in a way that should be applicable to many problems. We’ll working through debugging some example C programs together, and then you can work with your neighbors to debug some more challenging programs.
Although we are using C examples, everything we do today also applies to using gdb and valgrind for C++ as well (and Python’s pdb debugger has almost identical commands to gdb).
Why should you learn to use debugging tools?
-
Investing a little bit of time to learn how to use debugging tools will save you hours/days/years of time and frustration finding and fixing bugs in your programs!
-
Helps to develop more productive programming practices!
-
Aids in gaining a deeper understanding of how a program is run by a computer, including its execution control flow and how it accesses its memory (stack and heap memory in particular)! This understanding helps you to write better (less buggy) code in the first place.
-
Impress and help your friends with your debugging prowess!
A Reminder about Program Memory
The GNU Debugger (GDB) allows you to pause a running program to inspect its execution state (i.e. examine its memory contents at a pause point (or breakpoint) in its execution). Because debugging tools are about examining program execution state to help find and fix bugs. It is important that as programmers we keep in mind what we know about program memory, and it often is very helpful to draw some small memory diagrams as you use a debugger to add some additional insight or notes to keep track of what you have learned in your debugging session and what is going on in your program’s memory as you step through its execution in gdb.
Because understanding program memory is important to debugging, let’s first remind ourselves what we know about program memory…
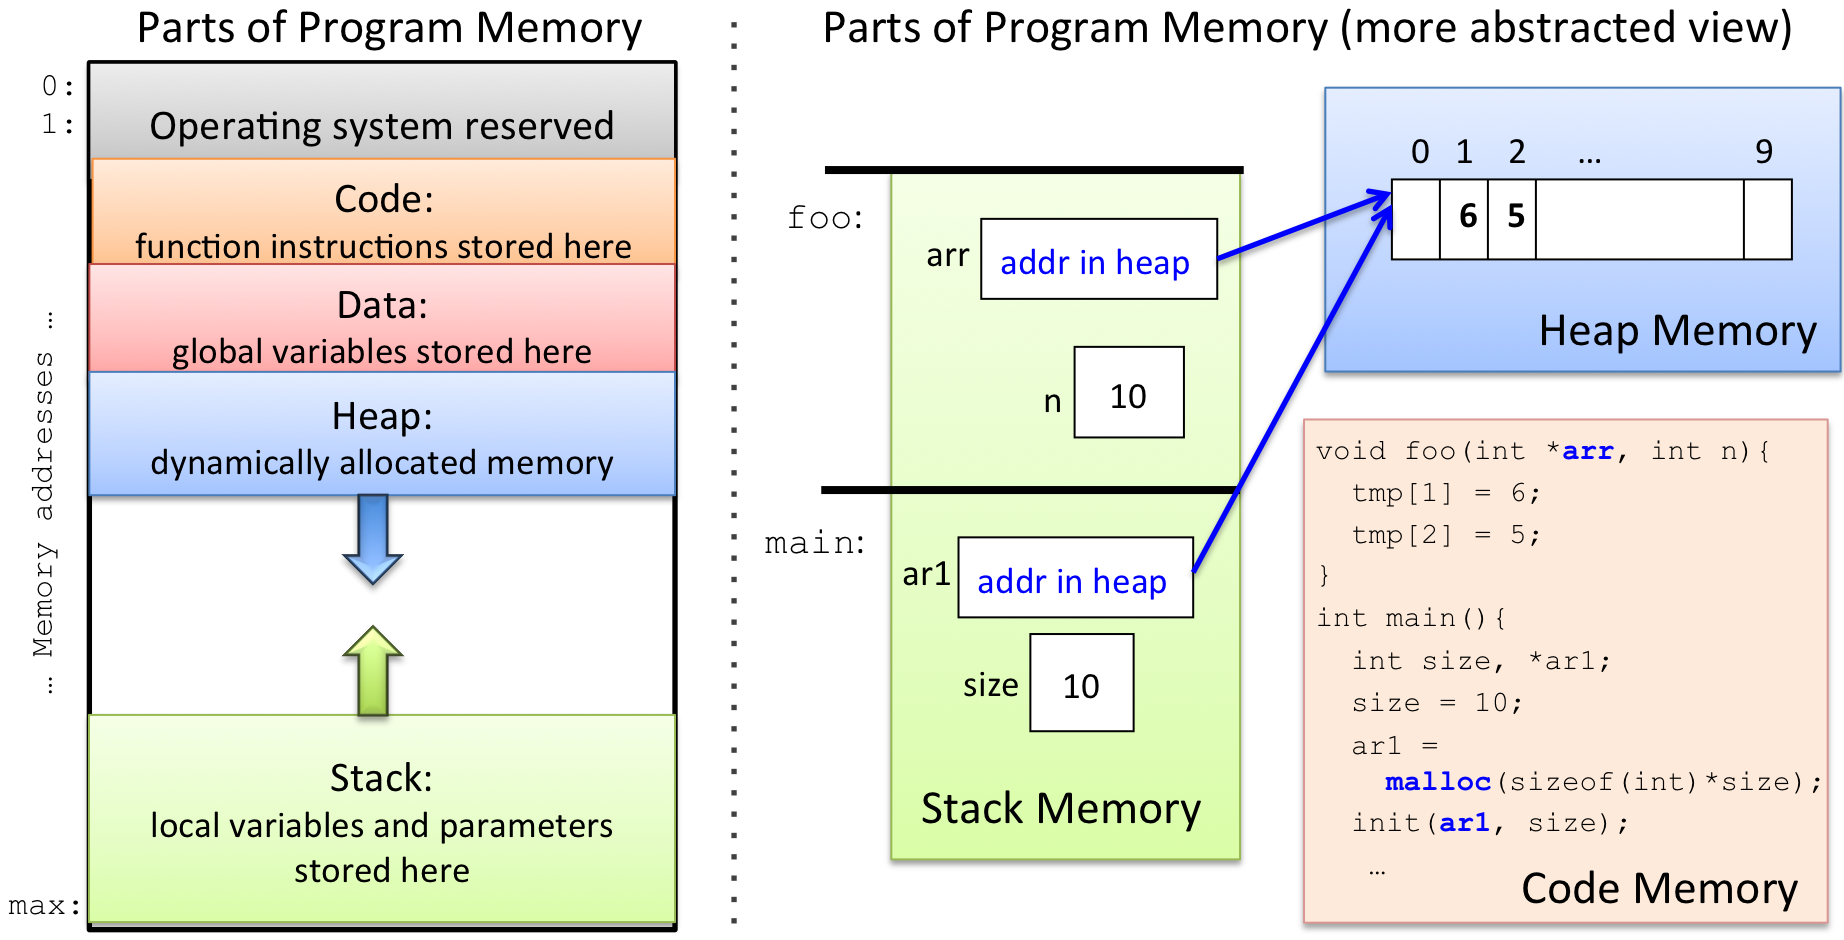
If you have taken CS31, you know that the OS divides a process’s memory into several regions (shown on the left of the figure below). When allocating memory to a variable, the C compiler picks a memory region for it based on how/where you declare the variable. As your program runs, it may dynamically allocate and free memory as it needs it. This memory comes from another part of the program’s memory space. If you haven’t yet taken CS31, then you know about these parts of memory in a slightly more abstracted view (shown on the right of the figure below).
-
Local variables and function parameters are allocated in Stack memory. When your program makes a function call a new stack frame is pushed to the top of the stack for the called function. Space for its local variables and parameters are allocated in its stack frame. The stack frame on the top of the stack corresponds to the function that is actively being executed (its local variables and parameters are in scope). When a function returns to its caller, its stack frame is pop’ed off the stack, and the calling function’s stack frame is now at the top of the stack (now its variables and parameters are in scope). Stack memory is implicitly allocated and freed via function call and return (call grows the stack, and return shrinks it).
-
When your program dynamically allocates memory with
malloc(), the C standard library allocates space for it in Heap memory (similarly in C++, a call tonewallocates space for a new object in Heap memory). No variables are allocated in Heap memory, but pointer variables can store the addresses of dynamically allocated heap memory (a pointer variable can "point to" a location in heap memory). Programs need to explicitly free dynamically allocated heap memory space when they are done using it (by callingfreein C ordeletein C++). -
Global variables are allocated in the Data part of memory. These variables are always in scope, meaning that they can be used at any point in the program’s execution.
-
Program instructions (function code) is located in the Code part of memory. A debugger sets breakpoints in this part of memory. When the program executes an instruction at a breakpoint (at a specific address in the Text part of memory), the gdb grabs control of its execution and lets the user examine the program’s runtime state at that point.
If you look at the mem_regions.c program in an editor or less,
you can see that it is printing out the memory address (memory locations)
of different types
of entities in program memory (code, global variables, local variables,
parameter, and malloc’ed heap space). Then try running it and see
some examples of where these address are in the program’s memory:
less mem_regions.c
./mem_regions
GDB Executive Summary
To invoke GDB on a program, execute the program with gdb in front of the
name:
gdb ./program
...
(gdb)
At this point, gdb displays its command prompt (gdb) at which you can
enter gdb debugging commands. Usually, the first thing a programmer does
is set a breakpoint in the main function. This tells gdb to pause the
program’s execution at the start of main. Next, the user starts the
program running in gdb using the run command
(or the run command with command line argument values if the
program takes command line arguments):
(gdb) break main          # set a breakpoint at main
(gdb) run                 # run the program from the beginning
(gdb) run arg1 arg2 ...   # run program with command line args: arg1 arg2 ...
GDB pauses the program’s execution whenever it hits a breakpoint, and it displays the gdb prompt (gdb)
at which the user can enter gdb commands to:
-
set more breakpoints
-
step through the program’s execution one statement at a time
-
continue its execution until the next breakpoint is reached
-
examine the program’s memory state (local variables, global variables, parameters)
-
examine the program’s stack
-
run make to incorporate some bug fixes into a long debugging session
-
set conditions on breakpoints, … , and a whole lot more.
Suggestion: Instead of repeatedly adding lots of print statements to your code, recompiling, and then running, you can can set a breakpoint in your program and then print any value you want. That way, if you forget to print a value (or you suddenly realize that you need more info), it’s easy to print other variables in the debugger (and to do so conditionally too!). Plus, you then don’t have to then go back in and modify your code to remove all the debug output.
Valgrind Executive Summary
Running a program with Valgrind is even easier than GDB. Just prefix
valgrind to the front of it on the command line:
valgrind ./program arg1 arg2 ...
The most common problems you’re likely to see are invalid accesses and uninitialized values.
-
An invalid access means your program is reading or writing a location in memory that doesn’t belong to one of your program’s variables. In addition to telling you the line number of the invalid access, Valgrind also tells you as much information as it can about the memory location and what might be nearby it.
For example, on an error that produces a segfault, it might say
Address 0x… is not stack’d, malloc’d or (recently) free’d. That’s Valgrind’s way of telling you "I have no idea what address you were trying to use." Often the address in such cases will be 0 (NULL).It might also tell you something like
Address 0x… is X bytes after a block of size Y alloc’d. Students often ignore messages like this one, but they can be very helpful! This one says that you malloced Y bytes, but the invalid access was just past that malloced block of memory. It will also tell you where in the program themalloccall was made to allocate it. -
Using an uninitialized value means that your program accessed a variable that holds garbage because you never set it. That is, even though the variable you accessed is stored at a valid location, the value it holds isn’t meaningful and should be treated as effectively random.
An exaggerated example might be something like:
int x;

if (x > 100) {
    // Do A
} else {
    // Do B
}
Here, we’re reading the value of
xwithout setting it first.
Suggestion: Unless your program does not dynamically allocate memory, you should always run your C programs with Valgrind if you’re still working on them. Valgrind’s warnings could easily turn into segfaults, and they typically also indicate that your program is not doing what you think it should be. Fix Valgrind errors before moving on to build another component of a program!
Let’s try it out!
For the rest of the time, we’ll be working through some examples. As you look over the challenges, try to draw or describe what’s happening in memory with as much detail as you can.
As we go over some examples of using gdb to debug programs, let’s refer to my GDB Guide, which has for information about (common GDB Commands), and some examples session using them.
And as we go over some examples of memory debugging using valgrind, let’s refer to my Valgrind Guide, for some example valgrind sessions and information about interpreting its output.
Let’s get started!
-
We will start with a program called
functionsto demo many gdb features. -
Next let’s look at
loopsto see how to set conditional breakpoints in gdb (and use thedisplaycommand). First try running it with some different values and see what happens (intereting things happen around 990) -
Next let’s look at
crashesto see how to use gdb and valgrind to figure out why a program segfaults. -
Next let’s take a big step and look at much more complicated program with some weird behavior,
workssometimes. Try running for different numbers of values (10, 20, 50, 100, 1000, …) and see if it works. Let’s try out some more gdb features (and try valgrind), and see what we can figure out. What parts of program memory seem to be the problem here? -
Next, try out
brokenwith gdb and see if you can find and fix some bugs. This program is very similar toworksometimesbut has different (and even more weird) behavior. After running a few times for different values, try running in valgrind. Does it help? Try running in gdb, and let’s see if we can figure out where things are going wrong. What parts of program memory seem to be the problem here?After we play around with this, let’s change the
CFLAGSdefinition in the Makefile, domake clean; makeand run again to see what happens…gccactually can help us find these type of bugs too. -
Try to debug
badprogon your own using what you have learned. Or for some more challenges, try out professor Webb’schallenge1andchallenge2programs with gdb and valgrind to see if you can find and fix some more bugs. -
And here are a few other cool (more advanced) things we likely will not get to today (see my GDB guide for more info and links to info about these):
-
you can run
makeinside gdb to recompile the executable and run the new version in gdb (this is nice if you have a lot of breakpoints set and you don’t want to have to start gdb all over from scratch). -
gdb supports TAB completion (this is particularly nice when function names are long, and for dealing with C++ name mangling). Try out in
brokenby doing:break 'get_then hit TAB. -
you can attach gdb to an already running program (this is nice if a program is stuck in an infinite loop well into its execution and you want to see what the heck it is doing).
-
you can change your program’s control flow, and send it signals, via gdb
-
you can debug at the assembly code level (but you already know that if you’ve taken CS31).
-
References and Links
-
my GDB Guide has example gdb sessions, info about specific gdb commands, and links to other gdb resources.
-
my Valgrind Guide, with example valgrind sessions, and links to other valgrind resources.
-
my Unix and CS help pages has more programming and debugging resources and links (C, C++, Python, others).
-
GNU Debugger (GDB) gnu.org webpage.
-
Valgrind memcheck tool documentation from valgrind.org.
-
pdb the Python debugger and pdb commands from python.org