CS81 Lab5: The Horde
In this lab you will experiment with the Horde architecture, introduced by Rich Sutton and his collaborators in the paper Horde: A scalable real-time architecture for learning knowledge from unsupervised sensorimotor interaction. The Horde is a collection of independent Demons, where each Demon is solving a simple reinforcement learning problem: to predict, given the current sensory state, how one sensor on the robot is affected by performing one constant action.
In a subsequent paper, Scaling life-long off-policy learning, they described a new reinforcement learning algorithm called Gradient Temporal Difference or GTD, which can handle noisy, incomplete data, scales linearly in the number of input features, requires constant computation per step, and is guaranteed to converge. Each Demon in the Horde uses the GTD method to learn.
Do an update81 to get the starting point files for this lab. You should now have the following files:
- horde.py: This contains the implementation of the Horde architecture.
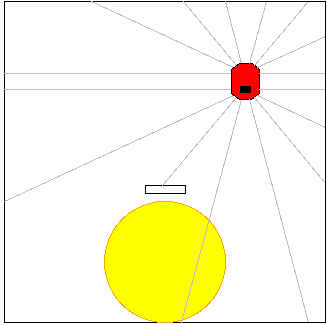
- HarderWorld.py: This is the definition of the Pyrobot world
shown below.
- mapPredictions.py: This program is used after the Horde has been trained to visualize what a particular Demon in the Horde has learned.
- achieveGoal.py: This program is used after the Horde has been trained to try to achieve a given goal, such as maximizing or minimizing a particular sensor.
When the Horde is trained, a Demon is created for every combination of sensor, action, and discount factor. In this experiment there are:
- 22 sensors (16 sonar, 2 light, 1 stall, 1 row, 1 col, and 1 north)
- 5 actions (left, right, forward, back, and stop)
- 1 discount factor (0.8)
Each Demon is given a name based on its sensor type, sensor index, action, and discount. For example in this experiment the demons have names like the following:
- sonar0-left-0.8
- sonar0-righ-0.8
- sonar0-forw-0.8
- sonar0-back-0.8
- sonar0-stop-0.8
- sonar1-left-0.8
- sonar1-righ-0.8
- sonar1-forw-0.8
- ...
The goal for each Demon is to learn to predict the discounted sum of its particular sensor over time as a result of constantly performing its particular action. For instance sonar3 is in the front of the robot. We would expect that the Demon sonar3-forw-0.8 would learn that its discounted sum will tend to be small because repeatedly going forward will eventually lead to crashing the front of the robot into a wall, causing sonar3 to return very small values. In contrast, we would expect that the Demon sonar3-back-0.8 would learn that its discounted sum will tend to be large because repeatedly going backward will eventually lead to crashing the back of the robot into a wall, causing sonar3 to be high.
Below is pseudocode describing how the Horde is trained while following a random action policy. Notice that half of the time the robot will perform the same action it did on the last time step. Otherwise it will pick another random action.
currAction = choice(possibleActions)
step = 0
while step < limit:
   currState = getFeatures()
   if random() < 0.5:
      currAction = choice(possibleActions)
   executeAction(currAction)
   nextState = getFeatures()
   for each demon that uses currAction:
      nextPred = demon.getValue(nextState)
      target = demon.rewardSensor.getValue()
      demon.update(currState, nextState, nextPred, target)
   step += 1
Notice that the data collected based on performing one action by the
robot is used to train all of the Demons that are focused on that
particular action. In our experiment, 1/5 of the Demons (or 22 out of
the 110) will be updated on each time step. This is a key element of
training such a large collection of Demons efficiently.
In order to analyze the success of the training, an additional if statement is inserted at the end of the while loop above.
   if step % 50 == 0:
      # suspend training
      record location of robot
      perform a test on demons using one of the possible actions
      record error
      randomly relocate robot
      # continue training
Many steps of training are needed before each Demon learns to make accurate predictions about the discounted sum of its particular sensor given its particular action under all of the different situations the robot can be in. And testing a subset of the Demons on a regular basis requires additional work. To save time, I have run an experiment for 100,000 steps and saved the results.
The first step in analyzing the results is to ensure that learning is converging over time. For each Demon, we will look at whether error is dropping over time, as well as whether the weights of its GTD algorithm are converging. We will focus on sonar11, one of the sonars on the back center of the robot, but the following steps would work for any other sensor as well.
- Go to the directory containing the results:
% cd /home/meeden/public/cs81/horde/results
When you do ls you'll see a large collection of files. For each Demon there will be a files with the following extensions: .g (raw error over time), .e (smoothed error over time), and .w (amount of weight changes to the GTD model over time). Each of these files contains 400 data points. This is because over the course of 100,000 training steps, tests were conducted every 50 time steps, for a total of 2000 tests. Each test focused on only one of the five possible actions, thus each Demon was tested 400 times over the course of the experiment. - Graph the raw error of the sonar11 Demons over time:
% xgraph 0-sonar11*.g
The results are quite noisy, and it is hard to distinguish whether there are any differences between the five actions. - Graph the smoothed error of the sonar11 Demons over time:
% xgraph 0-sonar11*.e
Now some structure is evident. Which actions were easier to predict? Does this make sense? - Graph the amount of weight changes occurring over time to the
sonar11 Demons:
% xgraph 0-sonar11*.w
The weight changes are growing smaller as training progresses indicating that the weights are converging. - Repeat the steps above for sonar3 which is at the front center of the robot. How are the results different?
- Repeat the steps above for a different type of sensor, such as light or stall. Do some types of sensors appear to be harder to learn than others?
- Another interesting question to consider is whether the robot is
adequately exploring the environment. Recall that every 50 time steps,
the location of the robot was recorded, a test was performed, and then
the robot was randomly relocated. To graph all of these saved
locations do:
% xgraph -P -nl 0-visited
Why is there a gap at the center of this plot?
Based on the previous section, we've seen that the individual Demons of the Horde have learned to make accurate predictions about the discounted sum of their sensors based on their particular actions. We can visualize what each Demon has learned as follows:
- Discretize the environment into a 5x5 grid.
- Place the simulated robot at each grid location with a particular heading.
- Ask a Demon to predict the discounted sum of its sensor value, given its action.
- Normalize all of these predictions.
- Color each grid location based on these normalized predictions, where 0=black, 1=white, and gray scale for intermediate values.
For example, the pictures below depict what the
Demon sonar3-forw-0.8 predicts when facing north (on left) vs
when facing south (on right).
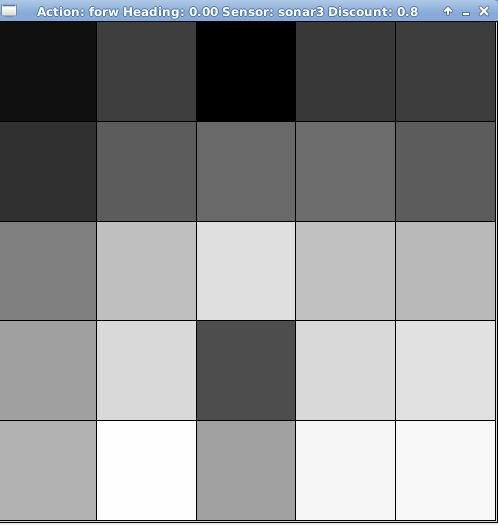
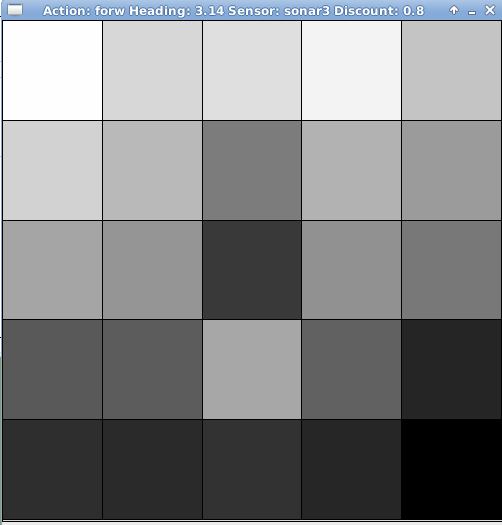
When facing north, this Demon predicts that being located in bottom row and moving forward will result in high discounted sums for sonar3, except in the grid location that is behind the small inner wall. In contrast, this same Demon predicts that when facing south, being located in the bottom row and moving forward will result in low discounted sums for sonar3.
These visualizations were generated by the program mapPredictions.py that was provided in this lab's directory. This program takes the following parameters:
- Action: stop, forw, back, left, or righ
- Heading in radians: This can be any heading, but here are some useful ones 0 (north), 1.57 (pi/2 west), 3.14 (pi south), 4.71 (3pi/2 east)
- Sensor: light, sonar, stall, col, row, north
- Sensor index: integer
- Discount: 0.8 (the only option in this experiment)
% python mapPredictions.py forw 0 sonar 3 0.8
Let's use the mapPredictions.py program to explore more about what the Horde has learned about this world.
- Notice that when the robot is facing north, the Demon sonar3-forw-0.8 predicts that the locations on the bottom right will return higher discounted sums than locations on the bottom left. Why would this be the case? As a comparison, look at the visualization for the Demon sonar4-forw-0.8.
- Now create visualizations for the Demon sonar3-forw-0.8 when facing east and west.
- Try looking at Demons with other sensor and action combinations.
The program achieveGoal.py can be used to control the robot so as to achieve simple goals such as maximizing or minimizing one of its sensors. This program takes the following parameters:
- Sensor: light, sonar, stall, col, row, north
- Sensor index: integer
- Discount: 0.8
- Goal: min, max
- World: harder
For example, let's try having the robot minimize sonar3 as follows:
% python achieveGoal.py sonar 3 0.8 min harderYou will first be allowed to position the robot somewhere in the environment. Once you press return the program will repeatedly query the five Demons that have learned about sonar3, and choose the action associated with the Demon that predicts the smallest value. It will also print out the predictions of each of these Demons on each step. After 10 steps have been completed, you can continue testing from the robot's current location, re-position the robot for another test, or quit the program. How does the robot behave in order to achieve this goal?
Let's attempt other goals using the program achieveGoal.py.
- Have the robot maximize sonar3.
- Try maximizing and minimizing other sensor types.
Pick two sensors to analyze that are of different types--one that the Horde seems to have an easy time learning about, and another that is more difficult. Use the programs mapPredictions.py and achieveGoals.py to create visualizations to help illustrate your analyses. Create a document that incorporates these visualizations with your explanation. Be sure to discuss why you think some sensor types are easier for the Horde to predict than others. Your write up should be 2-3 pages long.
Turn in a printout of your document and leave it outside my office by the due date.