hpsum-plot
	hpsum-plot is a small perl frontend for plotting the data from hpsum
	in gnuplot, the GNU graphical plotting utility.  It is a completely
	interactive script, and very intuitive.

Example
	after submitting the script that was in the last example of
	hpsum usage, here's an example of
	hpsum-plot in action:
	sh$ hpsum-plot
	I found the following directories, please select one:
	1:      .hpsum-996785959
	choice: 1
	these are the acceptable datatypes found:
	0:      PM_FPU0_CMPL
	1:      PM_FPU1_CMPL
	2:      PM_INST_CMPL
	3:      PM_BURSTRD_L2MISS
	4:      PM_CYC
	5:      PM_EXEC_FMA
	enter a type, or list of types separated by commas, or q to quit:
	(and incorrect entries will be filtered out silently)
	choice(s)>  0,1
|
< this is an image put out by gnuplot, which i captured in xv >
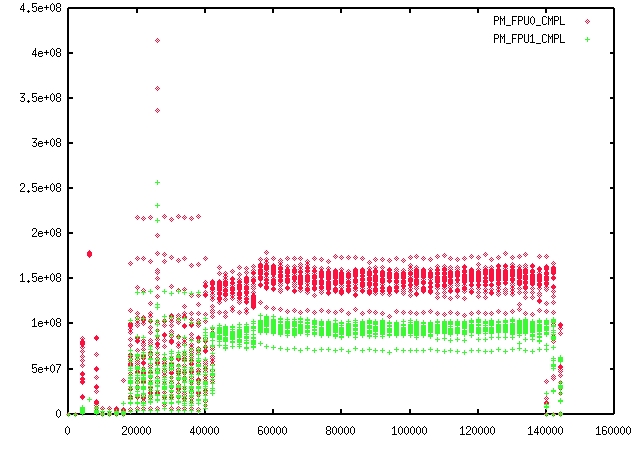 < the x axis is time, in milliseconds >
this is a rather simple example, but even in this case you can
watch the amount of floating point operations change as the
program moves through its lifespan. First, there is relatively
little activity, as the program initializes itself, then, over
the next 20 seconds there seems to be a widely varying amount
of floating point activity for each node, after which the
activity seems to average out at a certain rate until the end
of the program. At one point you can see that during this
averaged out rate, there is a small shift in activity just
before the 60 second mark. At this point the program actually
re-evaluated its setup and shifted around responsibilities for
calculations.
< the x axis is time, in milliseconds >
this is a rather simple example, but even in this case you can
watch the amount of floating point operations change as the
program moves through its lifespan. First, there is relatively
little activity, as the program initializes itself, then, over
the next 20 seconds there seems to be a widely varying amount
of floating point activity for each node, after which the
activity seems to average out at a certain rate until the end
of the program. At one point you can see that during this
averaged out rate, there is a small shift in activity just
before the 60 second mark. At this point the program actually
re-evaluated its setup and shifted around responsibilities for
calculations.