CS21 Lab 9: Zipcodes
A skeleton version of the program will appear when you run
update21 in a terminal window. The program
handin21 will only submit files in this directory. You may
work with a partner on this assignment.
The file /usr/local/doc/zipcodes.txt contains the data you need to write your program. This file is by no means complete. Some zipcodes were missing or did not have latitude and longitude data and were removed. For some cities, we did not have population data, so we set the population arbitrarily to 0. We hope that your favorite US city or hometown in the US is included in the data.
Each line of the file contains seven fields separated by commas representing the zipcode, latitude, longitude, city name, county name, state, and population, respectively. The entry for Swarthmore is shown below:
19081,39.897162,-075.344083,Swarthmore,Delaware,PA,6170
The full file has entries for 41824 unique zipcodes. You can open up the file in idle or any other text editor if you would like to look at the file in more detail. When you read in a line from this file you can use line.split(",") to separate the line into a list of strings.
You are required to use two dictionaries to store the records for each city. One dictionary must be indexed on zipcode. For example, if the dictionary is called zipDict then zipDict['19081'] should return all the necessary information about Swarthmore, PA. The other dictionary must be indexed on a string created from the city and state. For example, if the dictionary is called cityDict then cityDict['Swarthmore,PA'] should also return all the necessary information about Swarthmore, PA.
Your program will present the user with a menu such as this:
Zipcode Menu
-------------
0: Quit
1: Compute distances between zipcodes or cities
2: Plot all the zipcodes in one state
Enter choice>
You should have good error checking to ensure that the user provides a valid entry. For invalid entries, prompt the user to enter a new choice.
How you design your program is very much up to you. You should use top
down design to sketch out a basic outline of your program on paper
before you begin coding.
If the user selects option 1 from the main menu, you should prompt the user for two cities. The user can lookup a city by zipcode or by a city name and its two letter state abbreviation. For each city, display the following information:
- Full City, State, ZIP record
- County
- Population
- Latitude and Longitude
In addition to the information above, display the distance between the two cities the user typed.
A sample run is shown below. Information entered by the user is underlined.
Enter two cities (either by zipcode or by city and state)

CITY #1
Enter a zipcode or city, state> Swarthmore, PA
 City, State, ZIP:  Swarthmore, PA, 19081
           County:  Delaware
       Population:  6170
       Lat / Long:  39.90 / -75.34

CITY #2
Enter a zipcode or city, state> 90210
 City, State, ZIP:  Beverly Hills, CA, 90210
           County:  Los Angeles
       Population:  33784
       Lat / Long:  33.79 / -118.30

Distance between Swarthmore, PA and Beverly Hills, CA is 2391.6 miles
If you cannot find an entry for a particular city or zipcode, inform
the user that you cannot find that location and prompt them to enter
another location.
ZIPs as Strings
While you will be doing actual numerical computations with latitudes, longitudes, and populations, you do not need to numerically compare zipcodes. Furthermore, zipcodes beginning with zeroes will be truncated if interpreted as integers, e.g., 01238 will be interpreted as 1238. Store and print zipcodes as strings instead of numbers and you will save yourself a number of headaches.Reporting zipcodes
Many large cities and towns (Philadelphia, PA, for example) have
multiple zipcodes. When asked to report a zipcode for a city, you
can decide how to handle this. Possible options include reporting all
zipcodes for a particular city, reporting the first zipcode you find
for that city, reporting one example zipcode and stating there are
other possibilities, or designing a method of your own choosing. You
must report at least one zipcode for a city if
it is in the list of known cities.
Computing Distances
You should use the "great circle" distance formula to compute the distance between two cities. If the first city is at a geographic location (lat1, long1), and the second city is at (lat2, long2), then the distance between the two cities is given by the formula:
D = R acos( sin(lat1)sin(lat2) + cos(lat1)cos(lat2)cos(long2-long1))
Where R is the radius of the Earth (6371 km or 3963
miles), and acos is the inverse cosine. You can get this
function by importing the math library in python. Note that
each lat/long must be converted from degrees to radians before
computing a sine or cosine. Use the radians function in the
math library to do the conversion.
If the user selects option 2 from the main menu, you then ask the user to enter a state (PA, NJ, etc.) that they would like to plot. Once you have verified that the information they entered is valid (i.e. it corresponds to a real state in your database), you will plot a map of the locations of all the zipcodes in that state.
To do this you can use the longitude and latitude as x and y coordinates, respectively. You will want to create your graphics window so that it has the same aspect ratio as the state that you are drawing, and you will want to set the coordinates of the graphics window so that they match the minimum and maximum latitude and longitude of the state that you are drawing.
Creating the graphics window
Let's use the state of Iowa as an example. Iowa's latitude ranges from a minimum of 40.542856 to a maximum of 43.464701; Iowa's longitude ranges from a minimum of -96.509390 to a maximum of -90.218704. The aspect ratio of Iowa can be computed by taking the difference between the min and max latitude (the y coordinate) and the difference between min and max longitude (the x coordinate), and then computing their ratio. For Iowa, this turns out to be approximately .4645 since Iowa is wider than it is tall (see a map of Iowa). This means that when drawing Iowa, the dimensions of the graphics window in the y dimension (up/down) should be approximately .4645 times that of the x direction (left/right). You will want your graphics window to have a fixed size in the x direction of 500 pixels. You will need to compute the size of the y direction based on the aspect ratio.Plotting the points
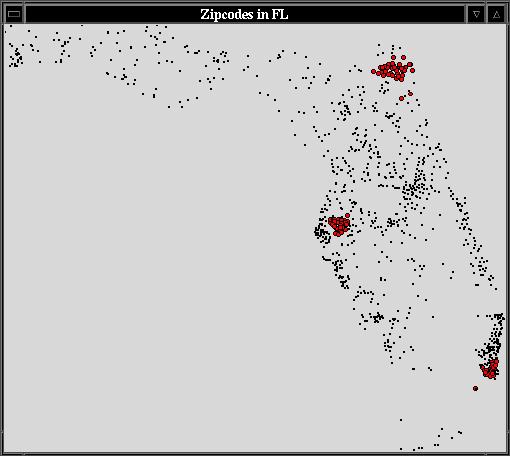
Before plotting the points, you will want to first use setCoords to set the coordinates of the window to match the min/max latitude/longitude of the state you are drawing.To plot the points, simply draw a black Point at each latitude and longitude in the zipcode database that corresponds to the state the user entered. For cities with a population larger than 250000, you should draw a small red Circle, rather than a Point. Be sure that the size of your circle is proportional to the size of the coordinate space you are drawing in. Doing this will ensure that red circles you are drawing in Connecticut (a small state) will have the same size circle as cities in Florida (a large state).
For example, below is the picture of Florida produced from this data.
After plotting the points, wait for a mouse click to close the window.
The graphics library is very slow when plotting hundreds or thousands of points, so do not worry if the program seems to be drawing a little slowly. Some very sparsely populated states (such as Alaska and Hawaii) may not look exactly like the state your are drawing.
A similar, but somewhat different, version of this program can be
found online: zipdecode
project.
Closest large city
In addition to printing the city, state, zip, county, population, latitude and longitude, also print the name and distance to the closest city with a population over 100,000. For example, when printing information about Swarthmore, you should report Philadelphia, PA as the closest city and also show the distance from Philadelphia from Swarthmore.Most isolated city
Find the city whose population is less than 100,000 (or some other threshold) and whose closest city with a population over 100,000 is furthest away. What happens as you change the population threshold? Note that this computation could be very time consuming. It might help to first build a separate list or dictionary of only the cities with a population over 100,000. There are only 224 such cities in our list, but these cities have over 6800 zipcodes. On my desktop, computing the closest city out of all possible cities for 10 separate cites took just under two seconds. For 1000 separate cities the calculation takes just over two minutes. Computing the distance between every pair of cities in the data set would take about an hour and a half. I don't recommend waiting that long for this assignment.Once you are satisfied with your program, hand it in by typing handin21 in a terminal window.