1. Goals for this week:
-
Learn more about how C program can map to assembly program and an executable binary program.
-
Practice writing and compiling Assembly (ASM) code.
-
Use the ASM visualizer to trace through Assembly code.
-
Introduction to Lab 5.
2. Starting Point Code
Start by creating a week06 in your cs31/WeeklyLabs subdirectory
and copying over some files:
$ cd ~/cs31/WeeklyLabs
$ mkdir week06
$ cd week06
$ pwd
/home/you/cs31/WeeklyLabs/week06
$ cp ~newhall/public/cs31/week06/* ./
$ ls
Makefile  dosomething.s  dosomething.c  prog.c simpleops.c
3. Assembly Practice Exercise
Before we get started on today’s in-lab exercises, we are going to start with an Exercise we would like you to try out.
Please DO NOT start this (DO NOT CLICK LINK) until I give you a brief introduction to what this is.
Please DO NOT start this before your lab time
TBA[Assembly Practice Exercise Link]
4. Using gcc to generate assembly
Let’s try out gcc to build assembly files and .o
files and look at the results. Open up simpleops.c.
We are going to look at how to use gcc to create an assembly version of
this file, how to create an object .o file, and how to examine its
contents. We are also going to look at how to used gdb to see the assembly
code and to step through the execution of individual instructions.
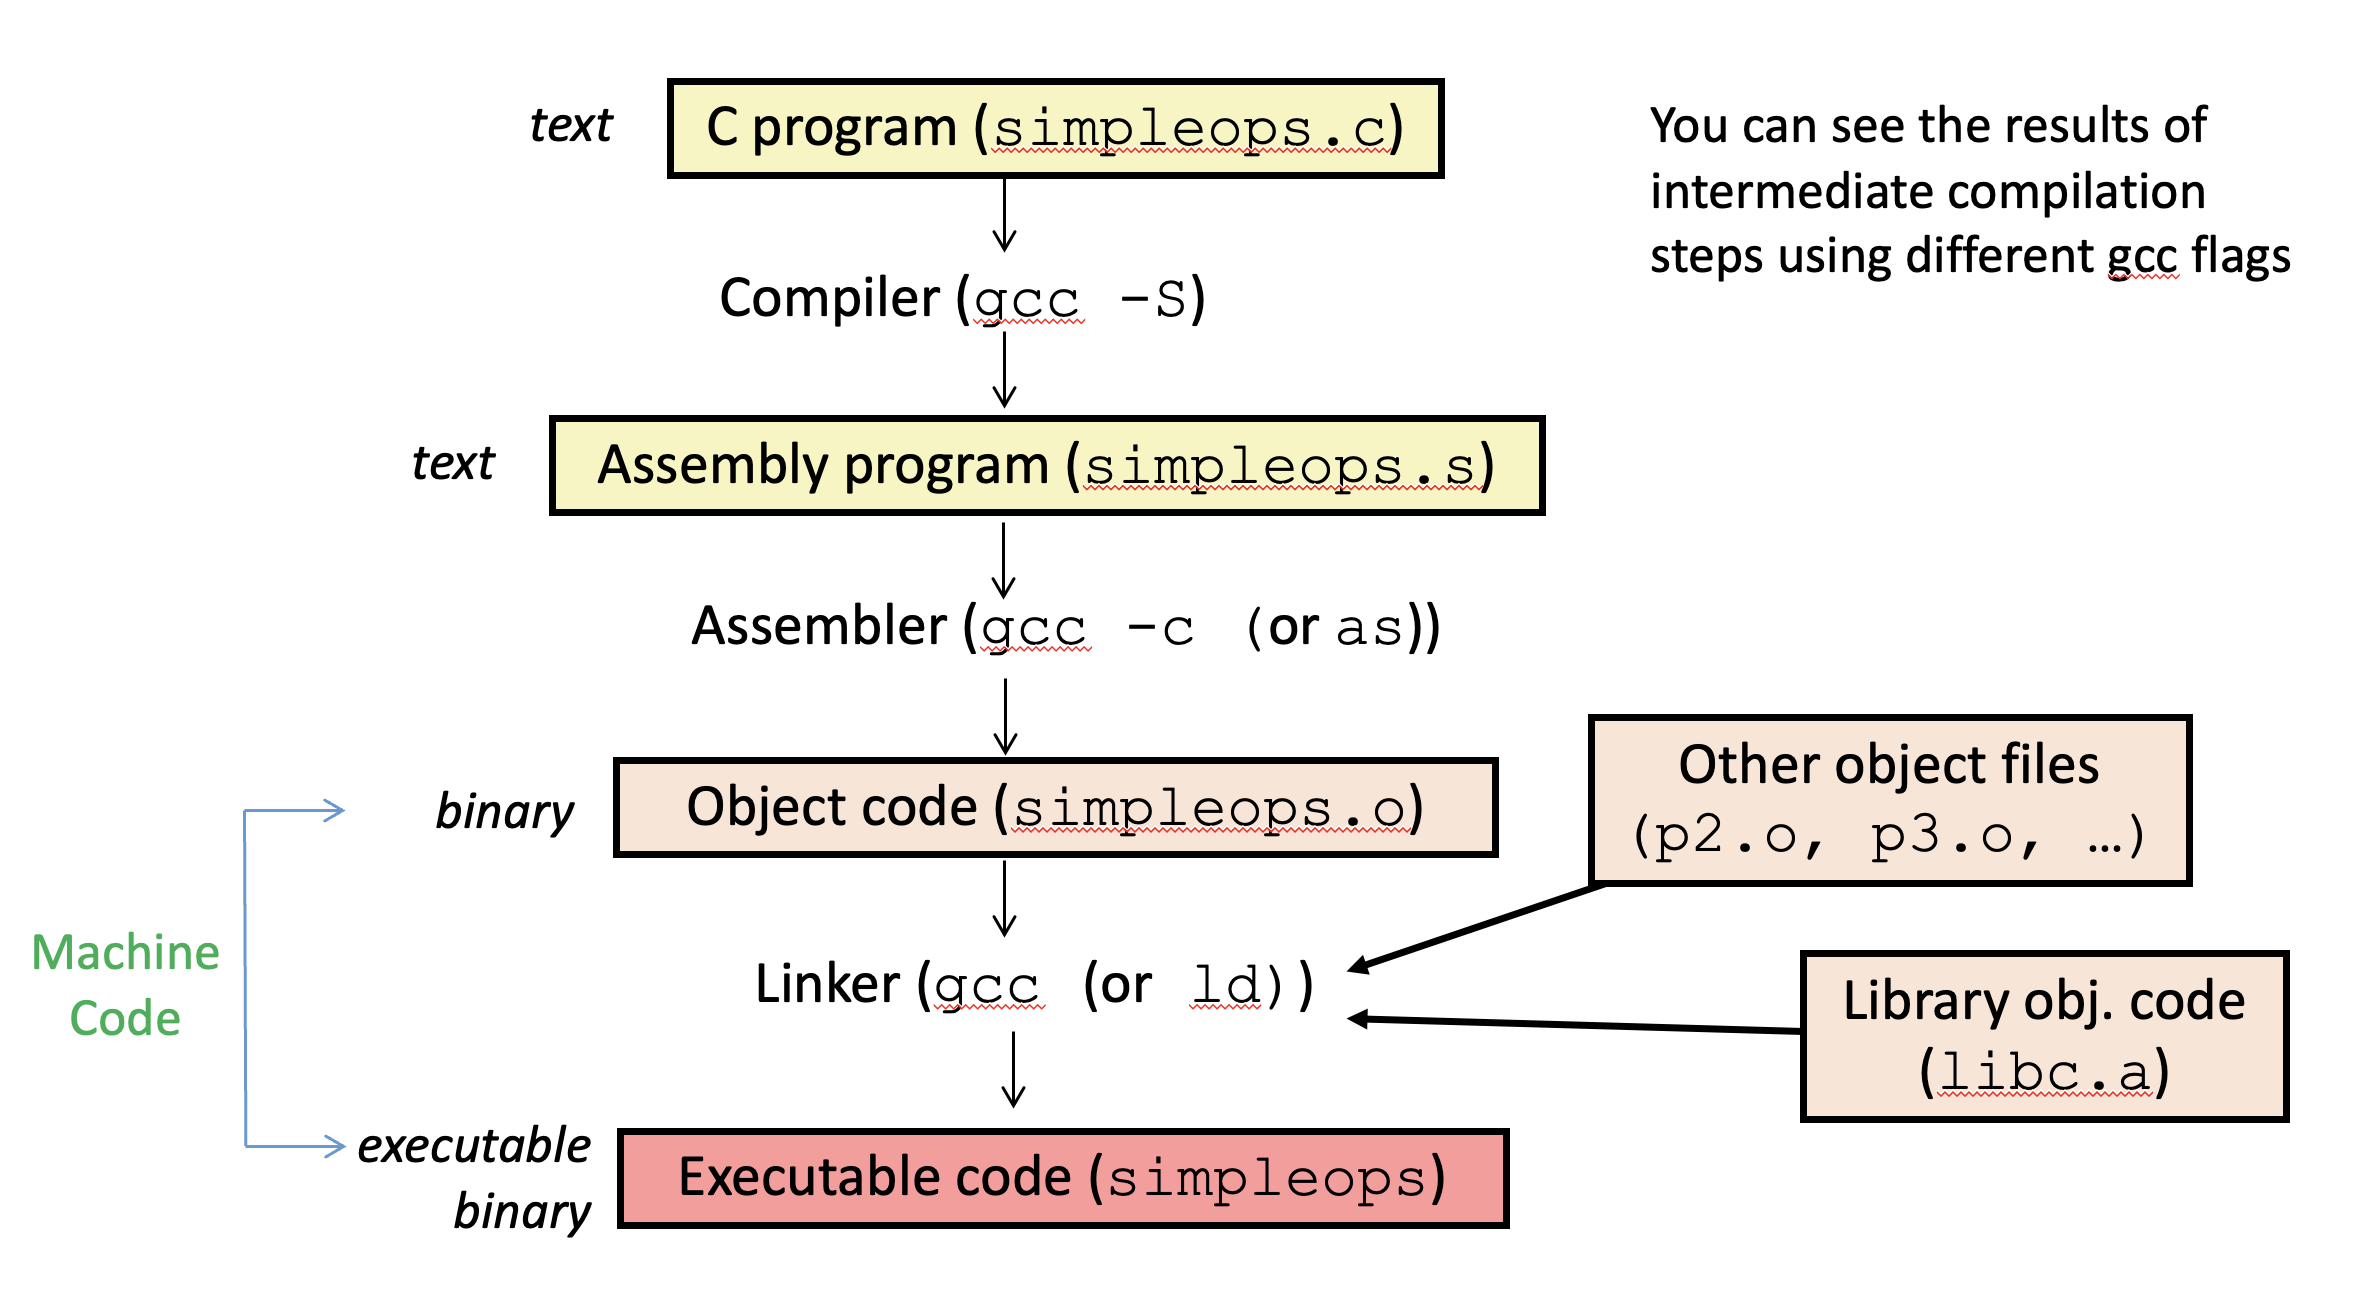
If you open the Makefile, you can see the rules for building .s, .o
and executable files from simpleops.c.
$ gcc -S simpleops.c                # just runs the assembler to create a .s text file
$ gcc -c simpleops.s                # compiles to a relocatable object binary file (.o)
$ gcc -o simpleops simpleops.o      # creates an executable file
To see the machine code and assembly code mappings in the .o file:
$ objdump -d simpleops.o
You can compare this to the assembly file:
$ cat simpleops.s
5. Compiling and Running Assembly Code on Lab Machines
As part of Lab 5, you’ll be writing some assembly code.
As you work on the lab, you may find it helpful to use the
ASM Visualizer (discussed next), but ultimately you’ll
need to submit a .s assembly code solution file that compiles and runs.
To compile and run a program that includes an assembly source file (whose
file name end in .s), do the following (this compiles prog from C source
file prog.c and assembly source file dosomething.s):
$ gcc -o prog prog.c dosomething.s
For the lab assignment, we provide a Make file that will do this step
for you:
$ make    # just type make to compile
$ ./prog
6. Writing x86_64 Assembly Code
We’re going to use ASM Visualizer for part of this next task. ASM Visualizer is an assembly visualization tool that was developed at Swarthmore. You can use this tool whenever you would like to trace x86_64 assembly code. For this in-lab exercise, we’d like you to test out two examples in the visualizer.
As you go, you may find it helpful to refer to the x86_64 instruction reference sheet.
|
If you run into problems with the visualizer tool, or if you have suggestions for ways to improve it, please send an email with details to professor Webb and/or professor Newhall. |
6.1. Task 1: Code Tracing
With with your lab partner, trace through the assembly code listed below to figure out what it is doing.
-
First, look at this code togther and describe to each other what it is doing. What, roughly, is the equivalent C code?
-
Next, paste this code into the Assembly Visualizer window (check that you have selected "x86=64" and are using the "Arithmetic" View. Copy in the code and then press "Run". This will take you to a tracing view where you can step through the execution of this code ("Next" and "Prev") seeing the results on registers and stack memory. Try it out and see if it does what you think it does.
  subq $16, %rsp
  movq $10, -8(%rbp)
  movq -8(%rbp), %rax
  movq $5, %rdx
  addq %rax, %rdx
  cmp %rax, %rdx

  jg .L1
  subq $3, %rax
  movq %rax, -16(%rbp)

  jmp .L2

.L1:
  movq $0xff, -16(%rbp)

.L2:
  movq -16(%rbp), %rax
  addq $16, %rsp
6.2. Task 2: Writing Assembly
For the second task, with your lab partner, you will write assembly
code to compute the sum of the values 1 to 5 using a loop.
For example, you could try converting the following while loop to
x86_64 (you can use stack locations %rbp-8 and %rbp-16 for the
variables i and sum):
i = 1;
sum = 0;
while (i <= 5) {
    sum = sum + i;
    i++;
}
You should do this in two steps, and we recommend that you write each up
in a file (ex. vim task2.txt1) so you can save a copy of your work:
-
Translate your loop to equivalent C goto form.
-
Convert the C goto form to x86_64 assembly.
Now, try running it in ASM Visualizer: when you have completed these two steps, copy your assembly code into the "Arithmetic View" of ASM Visualizer and trace through it to see if your translation is correct. We suggest you include the following first and last instrutions around your copied in solution (this creates a little more space on the stack, which helps visually when you trace through your code):
subq $32, %rsp
  # copy your solution in here
addq $32, %rsp|
We strongly suggest that you use an editor (e.g. vim) to write your code into a text file, and then copy it into ASM Visualizer when you’re ready to run it. This way you won’t lose your code if you accidentally refresh your browser window. |
7. Lab 5
Finally, let’s take a look at Lab 5.
8. Handy References
-
ASM Visualizer (choose
x86_64ISA) -
Section 3.2 and Section 3.5 of textbook (assembly debugging, print, display, info and x commands)
-
gdb cheat sheet summary of the most common/useful commands (2nd page is for assembly debugging)
-
GDB for Assembly (from the gdb Guide). (assembly debugging and x command)
-
Tools for examining phases of compiling and running C programs