CS21 Spring 2006
Homework 6
Due Friday, March 3 before noon.
You may work with a partner on this assignment. Again, if you do so,
please include both your names on the top-level comment and only one
of you submit your joint solution using cs21handin.
Start by copying over my starting point code:
# from your cs21/hw06 subdirectory:
% cp ~newhall/public/cs21/hw06/* .
note: I recommend doing parts 1-7
of this assignment before the midterm exam.
As practice for the
exam, first try writing up your solution to a method on paper,
then type it in and test to see if it is correct. Give yourself
about 15 minutes to write your solution on paper (this is about
the amount of time you would have on the exam to read a problem and
write down your solution).
This is an assignment designed to give you some practice with arrays
and writing and using methods with array parameters.
Starting with the starting point code, you will add some methods that
take array parameters, and then you will add code to main to test out
these methods. Remember to implement and test incrementally
to make debugging easier (i.e. implement one method, compile it, call
it to test it out, then implement the next method, compile it, test it,
and so on).
Here are things to add to the starting point code:
- Declare two int arrys that you will use to store grades
from two exams. You should initialize them from data read in
from a file. The first line of the file contains the number of
grades per exam (use this to create new arrays of the appropriate
size), the next lines contain all the grades for the first exam
followed by all the grades for the second exam. For example:
        Format of input file                     Example File
	--------------------                     -------------
     	number of grades per exam                    4
	exam1, grade1                                99
	examl, grade2                                78
	...                                          54
	exam1, gradeN                                75
	exam2, grade1                                76
	exam2, grade2                                97
	...                                          83
	exam2, gradeN                                100
- Write a static method PrintIntArray, that takes an array, its effective
size, a String label, and a value, n, for the number of bucket values
to print per line, and prints out the label, followed by the contents
of the array, n buckets per line. For example, a call to:
PrintIntArray(exam1, 10, "Exam 1:", 5);
Would print out something like:
     	Exam 1:
		60	88	70	55	82
		90	98	78	64	76
Call your PrintIntArray method to print out the contents of both
exam arrays, 10 grades per line.
The starting point code contains a stub method for PrintArray...you
need to add the code
- write a static method that returns maximum value in the array
- write a static method that returns the minimum value in the array
- write a static method that returns the mean (average) of the
values in the array
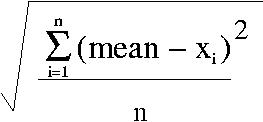
- write a static method that returns the standard deviation of the values in
the array. The only Math class library method you may use in your solution
is sqrt. The standard deviation is the square root of the sum of the
square of the difference the mean (average) and each value over the
number of values:
- Make calls to these methods for both arrays and ouput the results
in tabular format:
              min grade       max grade     ave grade       std dev
              ---------       ---------     ---------       -------
  Exam1:        44               99          72.400          17.990
  Exam2:        26               99          67.750          23.545
- Write a static method named Histogram, which takes a grades array,
its effective size, and returns a histogram array of the grades
array, where each bucket
in the histogram contains a count of the number of grades in a 10 grade
interval between 0-100. For example, histogram bucket 0 is a count of the
number of grades in the grade array that are between 0 and 9, histogram
bucket 1 contains a count of the number of grades in the histogram array
that are between 10 and 19, and so on.
A call to this method may look like
int[] histogram;

histogram = Histogram(exam1, num_grades);
- Write a static method named AsciiHistogram, that takes a histogram array,
its effective size, the low value in the range, the high value in the
range, and the bucketwidth, and prints out an ASCII graph of
the histogram values (think of this as a bar graph of the
histogram values that has been tipped on its side).
For example, the call to:
AsciiHistogram(histogram, num_buckets, 0, 100, 10);
May print out the following ascii graph representation of the
histogram data (here there would be 1 grade in the range 20-29, 1 in
the range 30-39, 4 in the range 40-49, and so on):
Histogram with bucket size of 10:
  0-  9:
 10- 19:
 20- 29: *
 30- 39: *
 40- 49: * * * *
 50- 59: * * *
 60- 69: *
 70- 79: * * *
 80- 89: * * *
 90- 99: * * * *
100    : * *
- Call your Histogram and AsciiHistogram methods with each exam array.
Sample Output from my program
% java StaticGradeInfo grade.data

exam 1:
          88   76   77   99   45   50   44   99   89   77
          66   55   44   56   98   78   88   66   77   76

exam 2:
          26   57   98   44   88   76   89   77   66   77
          99   45   88   99   33   44   50   99   44   56

           min grade       max grade       ave grade       std dev
           ---------       ---------       ---------       -------
Exam 1:        44               99          72.400          17.990
Exam 2:        26               99          67.750          23.545

Exam 1:
-------
Histogram with bucket size of 10:
  0-  9:
 10- 19:
 20- 29:
 30- 39:
 40- 49: * * *
 50- 59: * * *
 60- 69: * *
 70- 79: * * * * * *
 80- 89: * * *
 90- 99: * * *
100    :

Exam 2:
-------
Histogram with bucket size of 10:
  0-  9:
 10- 19:
 20- 29: *
 30- 39: *
 40- 49: * * * *
 50- 59: * * *
 60- 69: *
 70- 79: * * *
 80- 89: * * *
 90- 99: * * * *
100    :