CS21 Lab10: Optional parts of Zip Code assignment
As noted on main lab 10 assignment page, these questions are NOT required to receive full credit. Furthermore, do not attempt to solve these problems until the required portion of the assignment is complete.
k-closest cities
Instead of printing the closest city with a population over 100,000 (or some other threshold), find the k-closest large cities. Make sure that your cities are distinct. For example, if the user asks for the five closest large cities to Swarthmore, do not report five separate ZIP codes that are all located in Philadelphia.Most isolated city
Find the city whose population is less than 100,000 (or some other threshold) and whose closest city with a population over 100,000 is furthest away. What happens as you change the population threshold? Note that this computation could be very time consuming. It might help to first build a separate list or dictionary of only the cities with a population over 100,000. There are only 224 such cities in our list, but these cities have over 6800 ZIP codes. On my desktop, computing the closest city out of all possible cities for 10 separate cites took just under two seconds. For 1000 separate cities the calculation takes just over two minutes. Computing the distance between every pair of cities in the data set would take about an hour and a half. I don't recommend waiting that long for this assignment.Plot ZIP Codes
Plot a map of the locations of all the ZIP codes in a particular state, a particular county, or in a particular numerical range. The graphics library becomes very slow when plotting hundreds or thousands of points, so do not try to plot all the zip codes. If you get really fancy, you can draw circles to represent a ZIP code that is proportional to the size of the city. You could end up with something cool or a big messy blob. Excluding Alaska and Hawaii helps with the drawing, but may make Alaskans and Hawaiians upset. One cool version of this idea is the zipdecode project. Getting a decent looking picture requires you to scale the graphics window appropriatly so non-squarish states don't look too stretched or squished. To do this you can use the longitude and latitude as x and y coordinates, respectively. You will want to create your graphics window so that it has the same aspect ratio as the state that you are drawing, and you will want to set the coordinates of the graphics window so that they match the minimum and maximum latitude and longitude of the state that you are drawing.Creating the graphics window
Let's use the state of Iowa as an example. Iowa's latitude ranges from a minimum of 40.542856 to a maximum of 43.464701; Iowa's longitude ranges from a minimum of -96.509390 to a maximum of -90.218704. The aspect ratio of Iowa can be computed by taking the difference between the min and max latitude (the y coordinate) and the difference between min and max longitude (the x coordinate), and then computing their ratio. For Iowa, this turns out to be approximately .4645 since Iowa is wider than it is tall (see a map of Iowa). This means that when drawing Iowa, the dimensions of the graphics window in the y dimension (up/down) should be approximately .4645 times that of the x direction (left/right). You will want your graphics window to have a fixed size in the x direction of 500 pixels. You will need to compute the size of the y direction based on the aspect ratio.Plotting the points
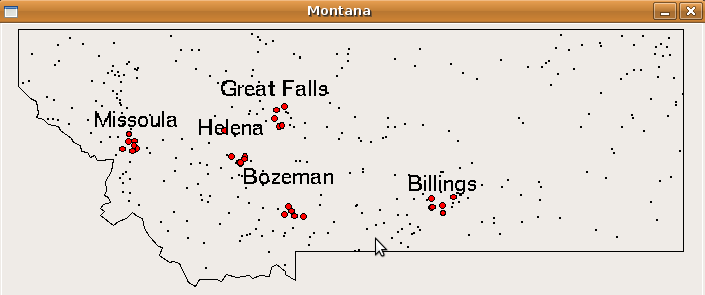
Before plotting the points, you will want to first use setCoords to set the coordinates of the window to match the min/max latitude/longitude of the state you are drawing.To plot the points, simply draw a black Point at each latitude and longitude in the zipcode database that corresponds to the state the user entered. For cities with a population larger than 250000 (or some smaller threshold for "flyover" states), you should draw a small red Circle, rather than a Point. Be sure that the size of your circle is proportional to the size of the coordinate space you are drawing in. Doing this will ensure that red circles you are drawing in Connecticut (a small state) will have the same size circle as cities in Florida (a large state).
For example, below is the picture of Montana produced from this data (the boundary polygon comes from another source. If you are interested in this, contact Prof. Danner.) After plotting the points, wait for a mouse click to close the window.