You are encouraged to work with a partner on this lab. Please read the following instructions carefully.
If you want to work alone do:
setup63-Lisa labs/09 noneIf you want to work with a partner, then one of you needs to run the following command while the other one waits until it finishes:
setup63-Lisa labs/09 partnerUsernameOnce the script finishes, the other partner should run it on their account.
cd ~/cs63/labs/09
cp -r /home/meeden/public/cs63/labs/09/* .
git add *
git commit -m "lab9 start"
git push
cd ~/cs63/labs/09
git pull
In this lab you will explore unsupervised learning, specifically bottom-up hierarchical clustering and k-means. You have been given a file called unsupervisedLearning.py that defines a base class with some common methods that read in data and calculate distance. You will be modifying the starting point files: hierarchicalCluster.py and kmeans.py.
Some sample data files have been provided. The UnsupervisedLearning class expects the data to be in the following format:
The data provided includes:
0.9 0.8 0.1 a1
0.9 0.1 0.6 b1
0.1 0.1 0.1 c1
0.8 0.9 0.2 a2
0.8 0.0 0.5 b2
0.0 0.0 0.2 c2
0.9 0.9 0.3 a3
0.2 0.0 0.0 c3
0.5 0.5 0.5 d1
The a points are close to (1,1,0); the b points are close to (1,0,0.5); the c points are close to (0,0,0), and the d point is an outlier. Notice that points c2 and c3 are equidistant from c1. A "good" clustering of these points would group the a's, the b's, and the c's separately.
Once you have implemented these unsupervised methods, you will pick your own data set to explore with them and analyze the results using the latex template provided in analysis.tex.
Execute the base class defined in unsupervisedLearning.py. Make sure you understand what class variables it creates. Note that it converts the points into numpy arrays to more efficiently calculate Euclidean distances.
One of the goals of unsupervised learning is to provide a description of data. In this section you will construct a hierarchical tree from the bottom up that shows how the data points are related to one another, helping to give insight about the data.
Let's walk through the steps using the small data set described above.
Use a dictionary that maps a cluster's label to the cluster's average point. The cluster's label will represent the tree structure that has been created so far. The leaves will simply be the point labels. Internal nodes will be tuples of the form:
(clNUM, leftBranch, rightBranch)
a3
a2
a1
b1
b2
c3
c2
c1
d1
('cl0', 'a3', 'a2')
a1
b1
b2
c3
c2
c1
d1
('cl0', 'a3', 'a2')
('cl1', 'b1', 'b2')
a1
c3
c2
c1
d1
('cl0', 'a3', 'a2')
('cl1', 'b1', 'b2')
a1
('cl2', 'c2', 'c1')
c3
d1
('cl3', ('cl0', 'a3', 'a2'), 'a1')
('cl1', 'b1', 'b2')
('cl2', 'c2', 'c1')
c3
d1
('cl4', ('cl2', 'c2', 'c1'), 'c3')
('cl3', ('cl0', 'a3', 'a2'), 'a1')
('cl1', 'b1', 'b2')
d1
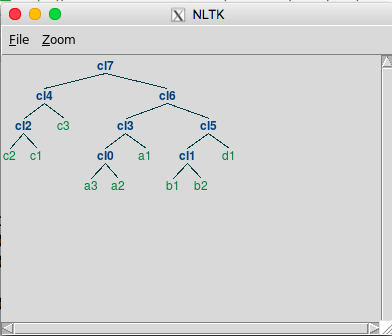
('cl7', ('cl4', ('cl2', 'c2', 'c1'), 'c3'), ('cl6', ('cl3', ('cl0',
'a3', 'a2'), 'a1'), ('cl5', ('cl1', 'b1', 'b2'), 'd1')))
This is the result that you want to create.
This tuple reflects the tree structure, but it can be hard to see the structure in this format. Using the plotTree method will generate a picture like this (your tree may have a different ordering for the c data):
Implement this bottom-up process now in the buildTree method of the HierarchicalCluster.
Once you can successfully create a hierarchical cluster for the small data. Try the subset data next, and finally the full digits data. Drawing the tree for the full data will take some time. Based on the final tree, which digits seem to be easier (and harder) for the network to classify?
You will need to grab some additional starting point files.
cd ~/cs63/labs/09
cp /home/meeden/public/cs63/labs/09/kmeans.py .
cp /home/meeden/public/cs63/labs/09/random.* .
Then add, commit, and push them to your git repo. If you are working with a partner, be sure that they do a git pull to get the new files.
git add kmeans.py random.points random.labels
git commit -m "kmeans start"
git push
You will implement k-means in the kmeans.py file. The additional data files, random.points and random.labels, consist of 200 2D points that were generated in two overlapping clumps. This data will be useful for testing k-means.
The k-means algorithm partitions the data into k clusters, where each cluster is defined by a center point. The goal is to minimize the distance between each center and the data points that are closest to it. The algorithm begins with an initial partitioning and then iteratively improves it until no further progress can be made.
The following data structures will be helpful in implementing the algorithm:
The following pseudocode describes the algorithm:
init k centers to be random points from the data set
init pointToCenter to be an empty dictionary
while True
   set updateFlag to False
   set error to 0
   in centerToMembers, init each center's member list to be empty
   for each point in the data set
      assign point to the closest center
      error += distance from center
      if point is being assigned for the first time or moved centers:
         update pointToCenter dictionary
         set updateFlag to True
   if not updateFlag
      break
   for each center
      if there are no points assigned to the center
         reassign the center to a new random point from the data set
      else
         update the center to be the average of its assigned points
Below is a trace of one execution of k-means on the small.points data that uses the showCenters method to print information about each center and its members. In the first iteration, points c3, a2, and a3 were selected as the initial centers.
ITERATION 1
Current error: 2.8477734056
--------------------
Center: c2 Length: 4
Center point: 0.200 0.000 0.000 c3
0.100 0.100 0.100 c1
0.800 0.000 0.500 b2
0.000 0.000 0.200 c2
0.200 0.000 0.000 c3
--------------------
Center: c1 Length: 3
Center point: 0.800 0.900 0.200 a2
0.900 0.800 0.100 a1
0.800 0.900 0.200 a2
0.500 0.500 0.500 d1
--------------------
Center: c0 Length: 2
Center point: 0.900 0.900 0.300 a3
0.900 0.100 0.600 b1
0.900 0.900 0.300 a3
In the next iteration, the error drops, and several of the points have shifted clusters (a3, b2, and d1).
ITERATION 2
Current error: 2.72339291187
--------------------
Center: c2 Length: 3
Center point: 0.275 0.025 0.200
0.100 0.100 0.100 c1
0.000 0.000 0.200 c2
0.200 0.000 0.000 c3
--------------------
Center: c1 Length: 3
Center point: 0.733 0.733 0.267
0.900 0.800 0.100 a1
0.800 0.900 0.200 a2
0.900 0.900 0.300 a3
--------------------
Center: c0 Length: 3
Center point: 0.900 0.500 0.450
0.900 0.100 0.600 b1
0.800 0.000 0.500 b2
0.500 0.500 0.500 d1
In the final iteration error drops again, but none of the points have moved centers, so the program ends.
ITERATION 3
Current error: 1.46750698081
--------------------
Center: c2 Length: 3
Center point: 0.100 0.033 0.100
0.100 0.100 0.100 c1
0.000 0.000 0.200 c2
0.200 0.000 0.000 c3
--------------------
Center: c1 Length: 3
Center point: 0.867 0.867 0.200
0.900 0.800 0.100 a1
0.800 0.900 0.200 a2
0.900 0.900 0.300 a3
--------------------
Center: c0 Length: 3
Center point: 0.733 0.200 0.533
0.900 0.100 0.600 b1
0.800 0.000 0.500 b2
0.500 0.500 0.500 d1
--------------------------------------------------
Centers have stabilized after 3 iterations
Final error: 1.46750698081
Remember that each run of k-means will be different. The algorithm is very sensitive to the initial conditions. The final assignments found in this particular run are the most common, but other assignments will also occur.
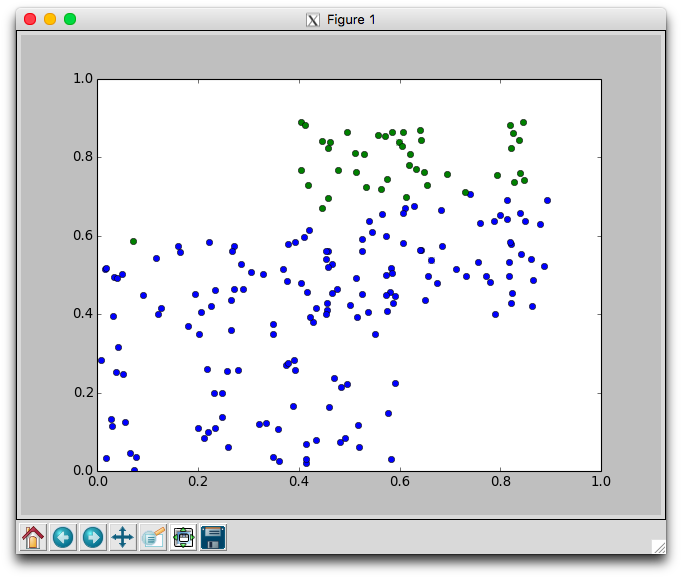
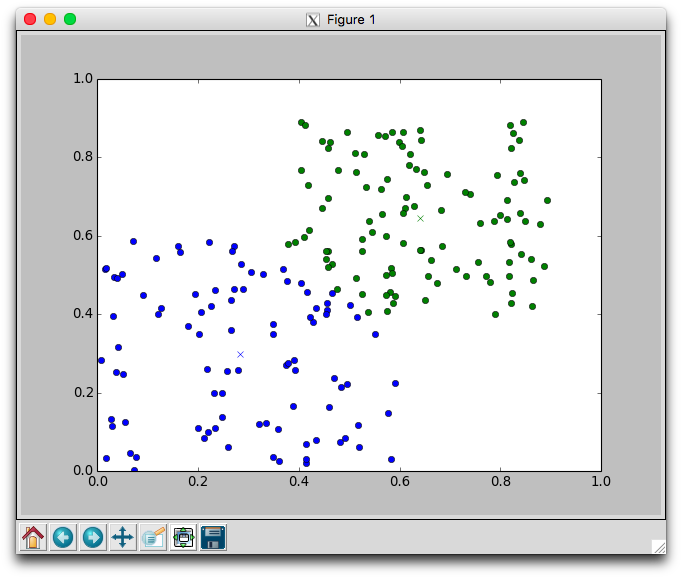
With two dimensional data we can plot the movement of the centers and the assignment of points to centers. Using the plotCenters method we can watch how the clusters evolve over time. After each iteration a plot will appear. The plot shows the center points as x's and the members as circles. Each cluster is color coded. You'll need to close the plot to continue to the next iteration.
Below is one run with k=2 using the random.points data that required 8 iterations to stabilize. Notice that the green cluster was initially quite small and over time grew downwards.


Try different different values for k on the random data. Recall that one of the issues with using k-means is that it is not always clear how to appropriately set k. Larger k will reduce error, but may create clusters that are over-fitted to the data.
Be sure to discuss how you chose k when you applied k-means to your own data set.
Find a data set that you are interested in exploring using unsupervised learning. Here are some places you can look for inspiration:
Apply your implementations of both hierarchical clustering and k-means to your data set. This may require you to do some pre-processing to put the data into the necessary format.
Write up your findings in the provided LaTeX template lab9.tex. To compile it do: pdflatex lab9.tex. To view the result do: evince lab9.pdf.
cd ~/cs63/labs/09
git add *.py yourDataFiles
git commit -m "final version"
git push