CS21B Lab 7: Protein Alignment and Similarity
The focus of this assignment is for you to practice using top-down design to construct your solution incrementally. Your program should be divided into a modular set of functions and the main function should be clear and concise. You should test each function individually as you write it. Remember that any data you need to persist throughout the program should be saved in main and then passed into functions that need access to it.
A skeleton version of the program alignment.py and a file of test data called fakeData.txt will appear in cs21/labs/07 when you run update21. The handin21 program will only submit files in this directory.
You may work with a partner on this assignment. If you work with a
partner, put your name and the name of your partner in the list of
authors at the top of your program. Only one partner should run
handin21 to submit the files for the group. Both partners
will receive the same grade.

In this assignment, you will compare the amino acid sequence of the Cytochrome c protein as expressed in a wide range of organisms. Cytochrome c is a highly conserved protein, which means that the amino acid sequence of the protein is very similar across different organisms. To compare the amino acid sequence in one organism to the amino acid sequence in another organism, you will align the protein sequences and use a substitution matrix to score the alignment. Sequences with higher scores are judged to be more similar to one another than sequences with lower scores.
Once you are able to determine the similarity between two protein sequences, you will create a similarity matrix, which will describe the pair-wise similarities between many organisms. From this similarity matrix, you can cluster the most similar organisms together into a binary tree that provides a way of determining the evolutionary similarity between the organisms you clustered.
Here are the major steps you'll need to accomplish:
- Read the names and amino acid sequences of various species from a file and save them into separate lists in your program.
- Initialize a list of lists with zeros to store the pair-wise alignment scores of all of the species.
- Given two aligned amino acid sequences, determine the alignment score.
- Consider all possible alignments between two amino acid sequences and find the best score.
- Compute the scores of the best pairwise alginments for all species.
- Draw the tree to reveal the evolutionary similarity between species.
For this lab, you will want your program to include the following import statement at the top of your file:
from genetics import drawTree, blosum80This will import the code necessary to complete this lab.
The file /usr/local/lib/genetics/cytochrome_c.txt contains the full data set that you will eventually need for the lab. The file /usr/local/lib/genetics/cytochrome_c-10.txt contains a subset of the full data set of just 10 species that you can use as an intermediary test of your program. The file fakeData.txt contains an even smaller set of simplified data that you should use as you initially develop your program.
Each line of these files consists of three pieces of comma separated information: a binomial name (e.g. "homo sapiens"), a common name (e.g. "human"), and the amino acid sequence for the Cytochrome c protein for that organism. Here is a sample of a few (partial) lines from the actual data:
homo sapiens,human,GDVEKGKKIFIMKCSQCHTVEKGGKHKTGPNLHGLFGRKTGQAPGYSY....
camelus dromedarius,dromedary camel,GDVEKGKKIFVQKCAQCHTVEKGGKHKTGPN....
tarsius bancanus,western tarsier,GDVEKGKKIFVQKCAQCHTVEKGGKHKTGXNLHG....
You will need to read each line of the file, extract each field, and accumulate the data into three lists: one storing the binomial name, one storing the common name, and one storing the amino acid sequences. For example, the list of common names from the above file would be ['human', 'dromedary camel', 'western tarsier'].
The binomial name, common name, and amino acid sequence for a
particular organism should all appear at the same position. In other
words, if the third item in the binomial name list is 'tarsius
bancanus', then the third item in the common name list should be
'western tarsier', and the third item in the sequence list
should be the amino acid sequence for the western tarsier.
scores = [0] * n
for i in range(n):
    scores[i] = [0] * n
Once you have created this two-dimensional list, you can store the
value x in row r, column c by writing
scores[r][c] = x.
This will create the two-dimensional list and initialize all of the
values to 0.
Suppose that there is a very small imaginary protein protA produced by three animals: a mouse, a fly and a bee. You would like to compare protA's amino acid sequence as found in each of these animals to figure out which two animals have the most similar sequence. Here are the amino acid sequences of each of these animal's protA:
mouse : AGDVEK
fly   : AGWVEK
bee   : AGFVEK
You can see that the mouse, fly and bee all have five amino acids in common and one that is different. However, aspartic acid (Asp/D) has a small, polar side chain and tryptophan (Trp/W) has a large, non-polar side chain. Because of the structural differences of these two amino acids, it is likely that substituting an Asp for a Trp would have an impact on the functionality of the protein. On the other hand, both Trp and Phenylalanine (Phe/F) have large, non-polar side chains terminating in a carbon ring. Therefore, it is likely that substituting a Phe for a Trp would have less of an impact on the protein's function than substituting an Asp for a Trp or Phe would have.
By studying the variances in proteins across species, biochemists have developed metrics that assign a numerical value to particular amino acid substitutions. In this lab, we will use the BLOSUM80 substitution matrix to quantify the difference between two proteins. BLOSUM80 assigns a positive score to likely differences and a negative score to unlikely differences. The most likely "difference" occurs when an amino acid in one sequence is identical to the amino acid in the other sequence. Here is a representation of the BLOSUM80 matrix. Notice that substituting a D for a W (find where the row labeled D intersects the column labeled W) has a score of -6, substituting a D for an F has a score of -4, and substituting an F for a W has a score of 0.
To find out the score for substituting 'D' for 'W' in your program, be sure you have imported the blosum80 function from the genetics library, then type blosum80('D','W').
With this matrix, we can now score the differences between any two sequences. We do this by computing the sum of the scores of all the substitutions necessary to transform one sequence into the other sequence.
To determine which too animals have the most similar sequences, we need to score each pair of animals. First, let's score the fly and mouse sequence alignment:
fly   :  A  G  W  V  E  K
mouse :  A  G  D  V  E  K
score :  5  6 -6  4  6  5  --> total = 5+6-6+4+6+5 = 20
Then, let's score the fly and bee sequence alignment:
fly   :  A  G  W  V  E  K
bee   :  A  G  F  V  E  K
score :  5  6  0  4  6  5  --> total = 5+6+0+4+6+5 = 26
And finally, let's score the bee and mouse sequence alignment:
mouse :  A  G  D  V  E  K
bee   :  A  G  F  V  E  K
score :  5  6 -4  4  6  5  --> total = 5+6+0+4+6+5 = 22
From this, we see that the fly and bee are the most similar (with a score of 26). We also see that the mouse is more similar to the bee (with a score of 22) than the fly (with a score of 20).
The above mouse, fly, and bee example showed how to score two aligned amino acid sequences. Now we must figure out how to align two amino acid sequences. Let's look at another hypothetical (and very short) protein produced by three animals from the fakeData.txt file:
horse :  GDVAK
cow   :  PAGDAER
pig   :  AGDVA
Notice that unlike in the previous example, the amino acid sequences in this example are not all the same length. The horse and pig sequences both have 5 amino acids, but the cow sequence has 7 amino acids. How can we score the alignment between the horse and cow sequences if they have different lengths?
Let's begin by introducing the notion of a gap. Whenever one sequence has an amino acid and the other does not, we will incur a gap penalty. The BLOSUM80 matrix does not define the gap penalty. For this lab, we use a gap penalty of -6. Gaps will be represented below by a dash. When you align a gap with an amino acid, you incur the gap penalty. If you align a dash with another dash, it incurs no penalty and should be scored as 0.
For example:
horse :  G  D  V  A  K  -  -
cow   :  P  A  G  D  A  E  R
score : -3 -2 -4 -2 -1 -6 -6  --> total = -3-2-4-2-1-6-6 = -24
A score of -24 is quite bad. Notice that this is not the only possible way to align the horse and cow sequences. Consider the following alternative:
horse :  -  -  G  D  V  A  K
cow   :  P  A  G  D  A  E  R
score : -6 -6  6  6  0 -1  2  --> total = -6-6+6+6+0-1+2 = 1
This alignment yields a much better score than the first alignment we tried.
In this lab, we will determine the similarity score between two sequences by choosing the maximum score of all possible alignments between one sequence and another. Note that we will make the simplifying assumption that gaps can only appear at the start and/or end of an amino acid sequence.
The only way to determine which alignment is the best is to consider every possible aligment. For the cow and horse, one way to view all of these alignments is shown below:
cow   : -  -  -  -  P  A  G  D  A  E  R  -  -  -  -
horse : G  D  V  A  K  -  -  -  -  -  -  -  -  -  -
score :-6 -6 -6 -6 -1 -6 -6 -6 -6 -6 -6  0  0  0  0  => -61

cow   : -  -  -  -  P  A  G  D  A  E  R  -  -  -  -
horse : -  G  D  V  A  K  -  -  -  -  -  -  -  -  -
score : 0 -6 -6 -6 -1 -1 -6 -6 -6 -6 -6  0  0  0  0  => -50

cow   : -  -  -  -  P  A  G  D  A  E  R  -  -  -  -
horse : -  -  G  D  V  A  K  -  -  -  -  -  -  -  -
score : 0  0 -6 -6 -3  5 -2 -6 -6 -6 -6  0  0  0  0  => -36

cow   : -  -  -  -  P  A  G  D  A  E  R  -  -  -  -
horse : -  -  -  G  D  V  A  K  -  -  -  -  -  -  -
score : 0  0  0 -6 -2  0  0 -1 -6 -6 -6  0  0  0  0  => -27

cow   : -  -  -  -  P  A  G  D  A  E  R  -  -  -  -
horse : -  -  -  -  G  D  V  A  K  -  -  -  -  -  -
score : 0  0  0  0 -3 -2 -4 -2 -1 -6 -6  0  0  0  0  => -24

cow   : -  -  -  -  P  A  G  D  A  E  R  -  -  -  -
horse : -  -  -  -  -  G  D  V  A  K  -  -  -  -  -
score : 0  0  0  0 -6  0 -2 -4  5  1 -6  0  0  0  0  => -12

cow   : -  -  -  -  P  A  G  D  A  E  R  -  -  -  -
horse : -  -  -  -  -  -  G  D  V  A  K  -  -  -  -
score : 0  0  0  0 -6 -6  6  6  0 -1  2  0  0  0  0  => 1

cow   : -  -  -  -  P  A  G  D  A  E  R  -  -  -  -
horse : -  -  -  -  -  -  -  G  D  V  A  K  -  -  -
score : 0  0  0  0 -6 -6 -6 -2 -2 -3 -2 -6  0  0  0  => -33

cow   : -  -  -  -  P  A  G  D  A  E  R  -  -  -  -
horse : -  -  -  -  -  -  -  -  G  D  V  A  K  -  -
score : 0  0  0  0 -6 -6 -6 -6  0  1 -3 -6 -6  0  0  => -38

cow   : -  -  -  -  P  A  G  D  A  E  R  -  -  -  -
horse : -  -  -  -  -  -  -  -  -  G  D  V  A  K  -
score : 0  0  0  0 -6 -6 -6 -6 -6 -3 -2 -6 -6 -6  0  => -53

cow   : -  -  -  -  P  A  G  D  A  E  R  -  -  -  -
horse : -  -  -  -  -  -  -  -  -  -  G  D  V  A  K
score : 0  0  0  0 -6 -6 -6 -6 -6 -6 -3 -6 -6 -6 -6  => -63
In order to create the binary tree to visualize the similarity between all of the organisms, you need to compute the similarity between each pair of organisms. The similarity score is symmetric, which means that similarity score between a bee and a fly is the same as the similarity score between a fly and a bee, so you don't need to compute both.
Let's first see how to store similarity scores in your scores list, by looking at an example. Assume you are comparing the dromedary camel (whose sequence should be in position 0 in your list of sequences) against the elderberry (whose sequence should be in position 10 in your list of sequences). Remember that the score of comparing one organism to another is the maximum score of all possible alignments of the amino acid sequences representing the two organisms. Once you have determined the maximum alignment score between the camel and the elderberry, you should store the score in scores[0][10], since that represents the score between organism 0 and organism 10. Also, remember that similarity scores are symmetric, so you can also store this same score in scores[10][0].
Now that you can store scores in your list, you need to do the pairwise comparisons. For each organism that you read in, you need to compare it to every other organism and store the score in the scores list. Note that this will take a while to complete, so you should start by first testing your code with the file fakeData.txt. You should obtain the following scores matrix using this data:
[[0, 1, 9], [1, 0, 4], [9, 4, 0]]
You may want to write a function to print the scores more nicely like this:
  0   1   9
  1   0   4
  9   4   0
Once your code is working on the fake data, next try using a small subset of the real data provided in the file /usr/local/lib/genetics/cytochrome_c-10.txt.
Once your program successfully handles these smaller test cases, you
can try it on the full data set.
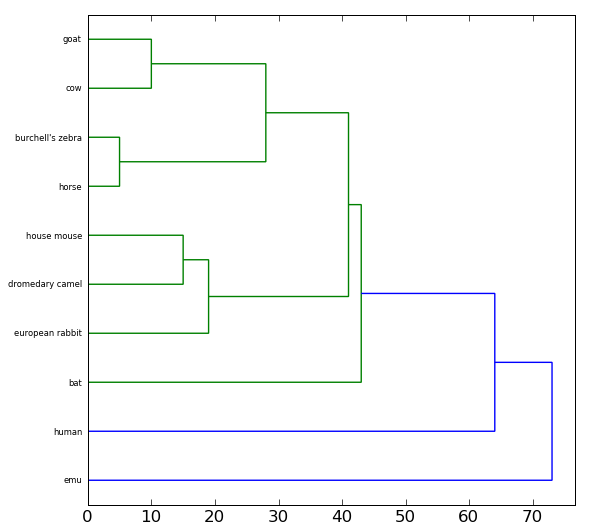
Once you have created the pairwise alignments, you can display a binary tree representing the similarity between the amino acid sequences for Cytochrome c in these organisms. You should find that organisms with more similar Cytochrome c sequences are more related than they are to organisms with more dissimilar sequences.
To draw the tree, you will use the drawTree function that you imported from the genetics library. The drawTree function takes two parameters: the two-dimensional list of similarity scores, and the list of common names (or binomial names, your preference) your read in earlier. For example:
drawTree(pairwiseScores, names)
For the data containing only 10 species your tree should look similar
to the following:
Once you are satisfied with your program, hand it in by typing handin21 at the unix prompt.