If you are stuck trying to find the error in your python program, using
a debugger like pudb can help. A debugger let's you step through your
program, one statement at a time, examining variables as you go. It is often
more efficient than adding lots of print statements.
Here's how you start pudb for a simple python program called blastoff.py:
$ pudb blastoff.py
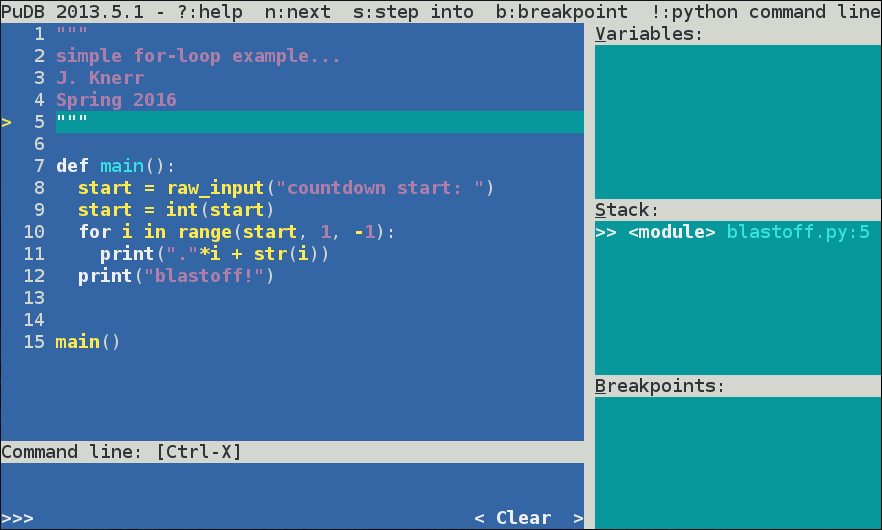
That should change the terminal window to like this:
The above shows the program source code, as well as other frames for current variables (empty, since we are not running the program yet), the stack, and breakpoints.
We often want to run to a certain point in the program, then stop and examine variables, or proceed one step at a time. This is done with breakpoints. Using the arrow keys to move the cursor to line 10, setting a breakpoint with the 'b' key, then running the program ('r'), results in this:
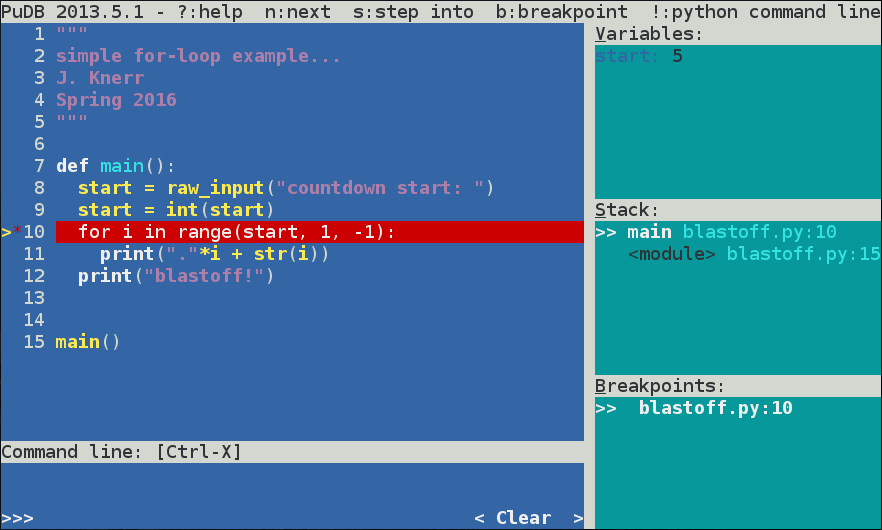
Things to note:
start = 5 (the user entered 5 on line 8)At this point we may want to keep running the program one line at a time.
Hitting the n key runs the next line of code (iterations of the for loop).
Here's what things look like after hitting the n key 7 times:
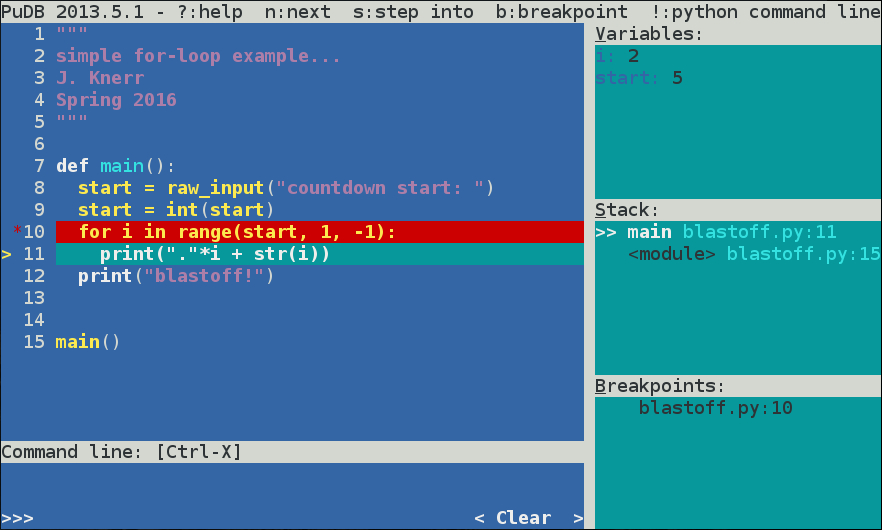
Notice we have executed the for loop a few times: i currently equals 2.
If you keep hitting n, you will eventually finish the for loop and hit
the print("blastoff") line. You will also see that i never gets all the
way down to the value 1 (the "bug" in this example).
Using breakpoints and "next", we can step though a program one line at a time, seeing what each variable is, as we go.
$ pudb myprogram.py
- set a breakpoint (use arrow keys to highlight line, then hit b key)
- run code to breakpoint (r key)
- run next line of code (n key)