We'd like to be able to create self-motivated, adaptive robots. In other words, we'd like robots to be able to decide what to learn and how to learn it without providing them with any specific tasks or goals. In addition, we'd like to observe qualitative changes in the the behavior of the robots over time that would indicate clear stages in their development.
Intelligent Adaptive Curiosity (IAC), created by Oudeyer and Kaplan, is one approach to trying to achieve self-motivated learning in a robot. The IAC model consists of a memory made up of a collection of regions. Each region covers one unique area of the sensorimotor space. Within each region resides an expert that is trying to learn to accurately predict how its sensory input will change given its current sensory input and chosen action. The job of each expert is summarized below:
Expert: Sensors(t) Motors(t) -> Sensors(t+1)Each region keeps track of how well its expert is performing. The IAC model chooses regions where learning progress is currently fast and avoids regions where learning progress is currently slow. Over time, as an expert begins to more accurately predict within a particular region, that region's progress will slow and the IAC model will focus the robot's attention to some new region where the progress is now better. Using IAC, the robot will autonomously choose what to learn.
We will experiment with a simulated robot situated in an enclosed world containing a light in one corner. The robot will have a ring of 16 sonar sensors and 2 front light sensors. Rather than use all of this data, we will create 3 summary sensors: the minimum front sonar, the minimum back sonar, and the maximum light sensor. The motor data will consist of translation and rotation values.
Our goal is to try to determine whether the robot's behavior undergoes some type of qualitative changes throughout the course of the experiment. We will run the robot for 5000 time steps and collect data about what it is doing for each block of 100 time steps. For each step we will check whether the robot is:
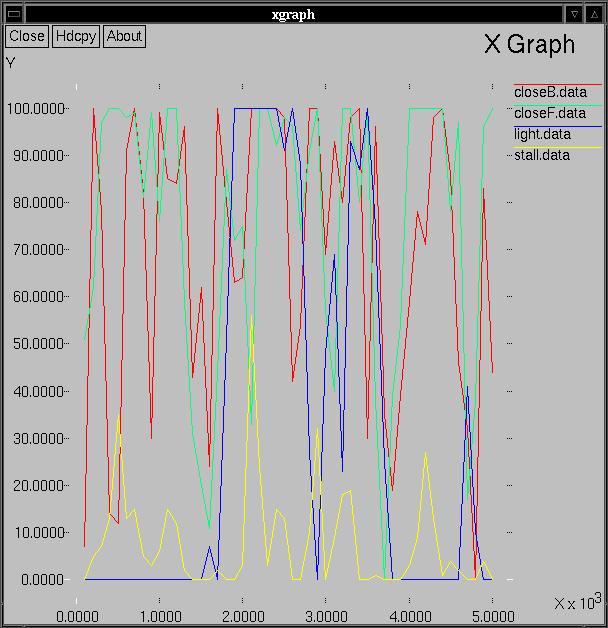
You will have to evaluate whether your particular graph shows evidence of stages in the learning process.
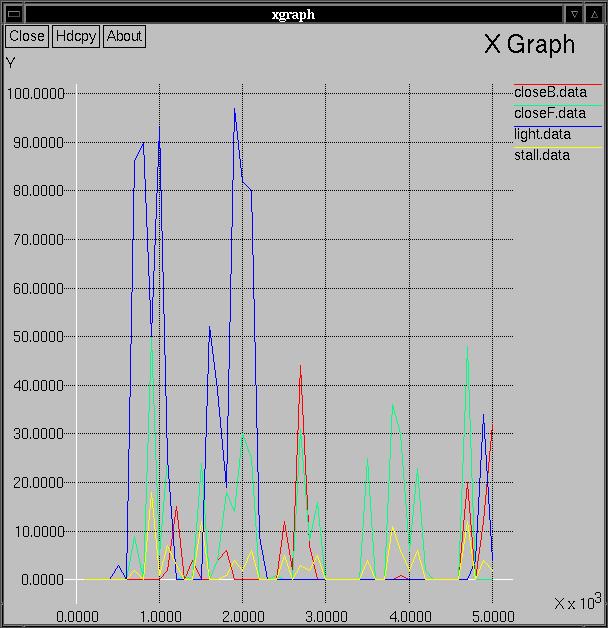
One question you may want to ask yourself is whether your graph appears any different than what would be produced by a robot being controlled by a completely random process. Below is an example of such a graph. I ran the same robot in the same world, but I completely igonored its sensors, and just randomly set its translation and rotation values.
update-cogs1
cd cogs1/labs/7
python iac.py &This will open up a pyrobot window. Then press the Run button. This will run the robot for 5000 steps. It will print the step number every 100 time steps. Observe the robot during throughout experiment. Keep some short notes about the the current time step, where it is in the environment, and what it seems to be doing.
xgraph -tk *.dataPrint out a copy of the graph by choosing "Hdcpy" in the top left corner, and then choosing "Postscript" as the output device. Finally select "Ok".
less memoryTo scroll up and down through this information, use the arrow keys. To quit, press "q". This will contain a series of lines like the following:
Region: size 41, learning progress -0.028, center 0.12 0.04 0.98 0.32 0.85
Region: size 41, learning progress -0.010, center 0.11 0.05 0.98 0.66 0.87
Region: size 45, learning progress 0.016, center 0.07 0.04 0.99 0.51 0.84
...
For each region, its size, learning progress, and prototypical member (called the center) is displayed. Recall that the data stored in each region of the memory consists of 5 values: minimum front sonar, minimum back sonar, maximum light sensor, scaled motor translation, scaled motor rotation. In the example above, only the last region shown has a positive learning progress. All three of these example are very similar in terms of the sensor values (close on front sonar, very close on back sonar, and very close to the light). The primary difference is in the motor translation values.