Lab Due Date: Tuesday, September 20, 11:59 PM
Lab 1 Goals
-
Get familiar with operating and running a VM
-
Apply your understanding of GDB to lauch a Shellcode attack on a vulnerable program.
-
Reinstate defenses in the system and successfully bypass these defenses to launch your attack .
Overview
This lab is built on the SEED Labs for Security Education project by Prof. Wenliang Du, at Syracuse University.
In this lab we will learn to deploy a virtual machine (VM) and launch a buffer overflow shellcode attack on a vulnerable program. Here’s the backstory for this lab!
It’s the year 1988, and you’ve just been hired by a fast-rising company, that’s been all the buzz lately, called Microsoft. You’re really excited with the position that you’ve been offered --- as a Penetration Tester. Your team provides you with code that they plan to release and are concerned that it’s got software vulnerabilities. They’ve heard recently about the havoc caused by the Morris Worm and do not want any of their systems to be vulnerable to such an attack.
Eager to get started, you look through the large codebase you’ve been given. It takes you many days and nights to get through the Voodoo Chicken Coding you see until finally you find a little module with the name stack.c. Curious, you investigate a little further by pulling up gdb and vim to look through the file.
Looking through stack.c you immediately spot the vulnerability - it’s the use of strcpy without any bounds checking! Excited to show your progress, you come up with a shellcode attack, by injecting code into the buffer that overflows the instruction pointer, and opens the shell prompt.
You go to your team with your discovery, your team suprisingly, (or not so suprisingly), is slightly defensive that you found a bug in what they thought was very well written code, and ask you to come up with a series of more complex attacks. You accept the challenge, and go off to create four levels of attacks with increasing complexity.
Lab Requirements
In this lab you are provided with program stack.c that has a buffer overflow vulnerability, and a file that generates shellcode called create_badfile.py. Your task is to exploit the vulnerability in stack.c and inject the shellcode onto the stack. Upon execution of the vulnerable program with the attack file that you provide as input, your attack should spawn a shell giving you access to run any command that you wish on the system!
This lab has four levels of increasing difficulty. We will first launch an attack by disabling the defenses that the compiler and OS put in place. Next, we will reinstate some of these defenses and try to continue our attack by circumventing these defenses. Your lab1 submission requirements are as follows:
-
Level 1: Launch a shellcode attack without any compiler or OS level protections. Submit your attack in the file
exploit-L1.py. -
Level 2: Launch a shellcode attack without knowledge of the buffer size in advance. Submit your attack in the file
exploit-L2.py. -
Level 3: Reinstate Address Space Layout Randomization and successfully launch a shellcode attack. Submit your attack in the file
brute-force.sh. -
Level 4: Use an extremely small buffer that will not hold the shellcode and successfully launch the attack. Submit your attack in the file
exploit-L4.py. -
Complete and submit
lab1-checkpoint.adocandlab1-worksheet.adoc
Weekly Deliverables
Week 1
-
Complete and submit
lab1-checkpoint.adoc. -
Show demo or significant progress towards completion of Level 1 in lab (09/14).
Week 2
-
Complete and submit 1-5 of the lab requirements.
Lab Functionality
Shown below is how your lab is expected to function for all four levels:
#---------------------------------
# LEVEL 1
#---------------------------------
# the first command to disable address space randomization
# you'll need to do this once every time you
# power on the system.

seed@VM:~/../lab1/$ sudo sysctl -w kernel.randomize_va_space=0

# update badfile using exploit-L1.py to defeat Level 1

seed@VM:~/../lab1/$ ./stack-L1
Input size: 517
$     <--- this is the shell prompt!
$ pwd
$ /home/seed/Documents/labs/lab1/
$ exit

#---------------------------------
# LEVEL 2
#---------------------------------
# update badfile using exploit-L2.py to defeat Level 2
# the output should look identical to Level 1

seed@VM:~/../lab1/$ ./stack-L2
Input size: 517
$     <--- this is the shell prompt!
$ exit

#---------------------------------
# LEVEL 3
#---------------------------------
# update brute_force.sh to defeat Level 3
# update badfile to the same file as Level 1

# for the attack, first reenable address
# space layout randomization

seed@VM:~/../lab1/$ sudo sysctl -w kernel.randomize_va_space=2

# the attack will take a couple of minutes to run,
# when it succeeds it should look something like the
# following:

seed@VM:~/../lab1/$ ./brute_force.sh
./brute_force.sh: line 14: 89226 Segmentation fault      ./stack-L1
1 minutes and 53 seconds elapsed.
The program has been running 77167 times so far.
Input size: 517
$     <--- this is the shell prompt!
$ exit

# brute_force.sh will keep running even after you
# exit the shell prompt. Use Ctrl+C to kill
# brute_force.sh


#---------------------------------
# LEVEL 4
#---------------------------------
# update badfile using exploit-L4.py to defeat Level 4
# the output should look identical to Level 1

# We need to turn ASLR off again for this level.

seed@VM:~/../lab1/$ sudo sysctl -w kernel.randomize_va_space=0

seed@VM:~/../lab1/$ ./stack-L4
Input size: 517
$     <--- this is the shell prompt!
$ exit
Getting your Lab1 Starting Point Code
| Stop here! If you haven’t installed your VM yet, first go to the section on getting your Virtual Machine setup. Once that is done, you will proceed with the following steps inside the Virtual Machine. |
Power-up the CS88 VM through VirtualBox and login. Then, pull up a browser in your VM and log into CS88 Github for our class and get the ssh-URL to your lab git repository. Follow along with the prompts below to SSH, create a lab directory and clone your lab repos. For a refresher on getting setup with git take a look at Git Setup. In this lab we will be using a VM (installation and setup steps below) where we will clone the code from github.
# Turn on your VM through virtualbox

# create a cs88/labs sub-directory in your home directory
$ seed@VM: mkdir ~/cs88
$ seed@VM: cd cs88
$ seed@VM: mkdir labs
$ seed@VM: cd labs

# clone your lab1 repo into your labs sub-directory
$ seed@VM: git clone [your-ssh-URL]

# change directory to list its contents
$ seed@VM: cd lab1-username1-username2

# ls should list the following contents
$ seed@VM: ls
 Makefile README.md lab1-worksheet.adoc
Lab Environment Setup
Most modern operating systems have implemented several security mechanisms that have made it increasingly difficult to launch a buffer overflow attack. In order to simplify our environment we will first disable these mechanisms.
-
Address Space Randomization: Most Linux-based systems uses address space layout randomization (ASLR) to randomize the starting address of the heap and stack. This makes guessing the exact addresses difficult; a critical step in buffer-overflow attacks. We can disable ASLR using the following command:
$ sudo sysctl -w kernel.randomize_va_space=0You will have to execute this command every time that you start your VM. This setting will persist until you shutoff the system. If you reenable ASLR for Level-3 remember to turn it off again to run your attacks on all the other levels. -
To re-enable ASLR for Level-3 run the following command:
$ sudo sysctl -w kernel.randomize_va_space=2 -
StackGuard and Non-Executable Stack: These are two additional countermeasures implemented by the compiler. They can be turned off during the compilation and added to our compilation
FLAGSin theMakefile. You can ensure that these flags are set, by taking a look at theMakefilein your starter code.-z execstack # disable a non-executable stack. -fno-stack-protector # disable stack canaries.
Understanding our vulnerable program
As we will see in class over the next two weeks, buffer overflows can severely compromise a system by allowing an attacker to execute arbitrary code.
The vulnerable program used in this lab is called stack.c. This program has a buffer-overflow vulnerability, and your job is to exploit this vulnerability and gain access to the shell prompt.
High-level functionality of stack.c:
-
We first read an input from a file called
badfile, and pass this input tochar stran array of 517 bytes inmain. -
This array then gets passed to a
char bufferarray in the functionbof(). -
While
char strcan have a maximum length of 517 bytes, thechar bufferarray inbof()is onlyBUF_SIZEbytes long, far less than 517! -
Because
strcpy()does not handle out-of-bounds errors, we now have a buffer overflow vulnerability. -
The attack vector for this program is from user input that
stack.ctakes in by reading a file. Here, we’ve called the filebadfile. -
Our objective is to create the contents for
badfile, such that when the vulnerable program copies the contents into its buffer, a shell can be spawned.
Make sure you are inside your virtual machine, and at the terminal, cd into your lab1 folder. Now, let’s first run make to compile stack.c:
seed@VM:~/../lab1$ make
# you should see the following output:
gcc -DBUF_SIZE=100 -z execstack -fno-stack-protector -m32 -o stack-L1 stack.c
gcc -DBUF_SIZE=100 -z execstack -fno-stack-protector -m32 -g -o stack-L1-dbg stack.c
sudo chown root stack-L1 && sudo chmod 4755 stack-L1
gcc -DBUF_SIZE=160 -z execstack -fno-stack-protector -m32 -o stack-L2 stack.c
gcc -DBUF_SIZE=160 -z execstack -fno-stack-protector -m32 -g -o stack-L2-dbg stack.c
sudo chown root stack-L2 && sudo chmod 4755 stack-L2
gcc -DBUF_SIZE=200 -z execstack -fno-stack-protector -o stack-L3 stack.c
gcc -DBUF_SIZE=200 -z execstack -fno-stack-protector -g -o stack-L3-dbg stack.c
sudo chown root stack-L3 && sudo chmod 4755 stack-L3
gcc -DBUF_SIZE=10 -z execstack -fno-stack-protector -m32 -o stack-L4 stack.c
gcc -DBUF_SIZE=10 -z execstack -fno-stack-protector -m32 -g -o stack-L4-dbg stack.c
sudo chown root stack-L4 && sudo chmod 4755 stack-L4

seed@VM:~/../lab1$ ls -la stack*

-rw-rw-r-- 1 seed seed  1054 Sep  7 08:12 stack.c
-rwsr-xr-x 1 root seed 15908 Sep  7 08:12 stack-L1
-rwxrwxr-x 1 seed seed 18688 Sep  7 08:12 stack-L1-dbg
-rwsr-xr-x 1 root seed 15908 Sep  7 08:12 stack-L2
-rwxrwxr-x 1 seed seed 18688 Sep  7 08:12 stack-L2-dbg
-rwsr-xr-x 1 root seed 15908 Sep  7 08:12 stack-L3
-rwxrwxr-x 1 seed seed 18688 Sep  7 08:12 stack-L3-dbg
-rwsr-xr-x 1 root seed 15908 Sep  7 08:12 stack-L4
-rwxrwxr-x 1 seed seed 18688 Sep  7 08:12 stack-L4-dbg

# We see the following:
# - a seperate stack executable for each level of the lab
# - for each level you should see:
#   - an executable: stack-L[num]
#   - and a file that you can use to debug: stack-L[num]-dbg
Now that we’ve run make we have an executable that’s ready for analyzing, scripting and attacking! Let’s first create our input badfile and run our stack-L1-dbg.
If you want to examine the stack executable in gdb use the executable that ends in debug or -dbg. For level 1 you would use stack-L1-dbg, for level 2 you would use stack-L2-dbg and so on. If you try running gdb on stack-L1 instead of stack-L1-dbg you won’t get any state setup since this executable has not been setup for debugging.
|
$ cat badfile-L1
$ AAAAAAAA

# lets copy badfile-L1 to badfile that stack.c takes as input

$ cp badfile-L1 badfile
$ ./stack-L1
Input size: 9
==== Returned Properly ====
We see that stack.c has no overflow and is perfectly happy with the input we’ve provided.
Now try using the python command similar to what we used in the last lab, to compose badfile such that we overflow the buffer in bof. How many characters would we need to overflow char buffer? Since we are using python3 in the VM, are command will look as follows:
|
python3 -c 'print("1"*[input_length])' > allAsDebugging stack.c
If you’ve managed to overflow the buffer congratulations! We can now inspect the state of the stack with the buffer using gdb to see what’s going on. Remember to use stack-L1-dbg with gdb!
gdb-peda$ gdb ./stack-L1-dbg
gdb-peda$ break main
gdb-peda$ break dummy_function
gdb-peda$ break bof
You will notice that the gdb installed on this Linux VM is slightly different to the one that we use on the CS machines. Here’s an introduction to gdb-peda. And a list of other commercially available disassemblers like gdb.
Let’s take a look at the disassembled output of main:
gdb-peda$ disas mainIf you observe the disasembly you might notice something looks a bit different. For example, at a memory address of <+19>, we see the following instruction 0x000012f3 <+19>: sub esp, 0x210. Looking at it, you might be thinking - wait: this is not in the source, destination format that we are used to! And also, where are all the $ and % signs in front of all the registers?
What we are seeing is a different x86 syntax called the Intel syntax. The Intel syntax (which we are using in the VM) is much simpler to read than the AT&T syntax we use on the lab machines. The most important difference between the two is the direction of operands.
Take a look at this cheatsheet for a list of the differences. You can also outside your VM, run gdb fib in lab-0 to compare the differences between the two syntaxes.
As you work through and compare the assembly instructions in main, with the source C code, you will come across that use the representation DWORD PTR. Take a look at this x86 reference and scroll to "Size Directives" to understand this instruction.
Since the main function has code that reads input from the file badfile, we don’t need to provide command-line input to stack.
gdb-peda$ break *main+157
gdb-peda$ run
You should see a lot of extra information shown in gdb-peda than than regular gdb. Each section that gdb-peda shows is demarcated with [--------] and a title. You should see three sections:
-
registers: showing all the values stored in the registers, and if the value is a valid memory address, then we also see the value at that memory location
-
code: the instruction that’s currently being executed by
eip, and +/- 3 lines around the current instruction. -
stack: the top 32 bytes (or 8 words) on the stack. this is equivalent to
x/8wx $esp.
Try to figure out the memory address of the char str array.
|
We can now continue running until we enter dummy_function. Below are a few more handy gdb instructions to help you navigate through the code. Note that in this example, the input I’ve provided is an array of all `1`s.
gdb-peda$ c
Continuing.
Breakpoint 3, bof (str=0xffffcf63 '1' <repeats 200 times>...) at stack.c:16
16	{
# you can use the list command to see the code that's currently
# being executed
gdb-peda$ list# we can also use the where command to see all the stack frames on the stack. The top of the stack is at index "0"
gdb-peda$ where
#0 bof (str=0xffffcf63 '1' <repeats 200 times>...) at stack.c:16
#1 0x565563ee in dummy_function (str=0xffffcf63 '1' <repeats 200 times>...)
at stack.c:49
#2 0x56556382 in main (argc=0x1, argv=0xffffd224) at stack.c:37
#3 0xf7debee5 in __libc_start_main () from /lib32/libc.so.6
#4 0x565561a5 in _start ()# the examine command "x" is really handy to examine <n>
# instructions starting from eip. In this example we are looking at
# 10 instructions starting from eip.
gdb-peda$ x/10i $eip
=> 0x565562ad <bof>: endbr32
0x565562b1 <bof+4>: push ebp
0x565562b2 <bof+5>: mov ebp,esp
0x565562b4 <bof+7>: push ebx
0x565562b5 <bof+8>: sub esp,0x74
0x565562b8 <bof+11>: call 0x565563f7 <__x86.get_pc_thunk.ax>
0x565562bd <bof+16>: add eax,0x2cfb
0x565562c2 <bof+21>: sub esp,0x8
0x565562c5 <bof+24>: push DWORD PTR [ebp+0x8]
0x565562c8 <bof+27>: lea edx,[ebp-0x6c]Now, if we disassemble bof, we see the call to strcpy at the memory address *bof+33. And similar to lab0 you are now ready to figure out setting up your attack file!
Now that we are in bof you have the entire stack layout starting from main through dummy_function and bof. You should be all set to start attempting lab1-checkpoint.adoc.
|
Injecting shellcode into our attack payload
Now that we have some familiarity with gdb-peda and the stack layout for our vulnerable program, let’s look at how we can inject malicious code into our buffer.
A shellcode is basically a piece of code that launches a shell. If we use C code to implement it, it will look like the following:
#include <stdio.h>
int main() {
   char *shell[2];

shell[0] = "/bin/sh";
shell[1] = NULL;
execve(shell[0], &shell[0], NULL);
exit(0);
}
Shellcode can do practically anything! A non-exhaustive list of very bad things:
-
creating a new user on the system
-
changing the user’s password
-
bind a shell to a network port (remote shell)
-
open a connection to the attacker machine
-
…. [the list goes on]
We can’t however, modify the existing code in stack.c for our attack. Instead, we need to find a way to embed the assembly instructions equivalent to the C program into our char array.
Think about how you might inject this shellcode into our attack without modifying stack.c
|
We might be tempted to simply compile this code on our end, and then disass main and use the assembly generated from there to inject it into our buffer. Good thinking! Here’s the assembly equivalent of the C code we saw above:
shellcode in Assembly
 jmp 0x26             # 2 bytes  │
 pop esi              # 1 byte   │
 mov 0x8(esi), esi    # 3 bytes  │ setup
 mov 0x7(esi), 0x0    # 4 bytes  │
 mov 0xc(esi), 0x0    # 7 bytes  │
 mov eax, 0xb         # 5 bytes    │
 mov ebx, esi         # 2 bytes    │
 lea ecx, 0x8(esi)    # 3 bytes    │ execv()
 lea edx, 0xc(esi)    # 3 bytes    │
 int 0x80             # 2 bytes    │
 mov eax, 0x1         # 5 bytes  │
 mov ebx, 0x0         # 5 bytes  │ exit()
 int 0x80             # 2 bytes  │
 call -0x2b           # 5 bytes    │
 .string \"/bin/sh\"  # 8 bytes    │ setup
However, when we try to copy the instructions associated with this code into a string buffer we will unfortunately not be able to copy the entire attack code. The reason here is due to the fact that the shellcode contains null bytes and by default any string function will stop copying data into a buffer if it sees a null terminating byte (i.e, 0x0). Spot any 0x0 s in the code above? What would you do to get around this?
|
In this lab, you are provided with the binary version of the shellcode for each level in the associated exploit-L[num].py file. Your task is to embed it into the buffer and have eip point to the location in your buffer that your shellcode lives.
Constructing our payload
The "attack sandwich" that we are trying to put together will have three elements:
-
the shellcode
-
the address that
eipshould point to within your buffer -
memset-ting the rest of your buffer with aNOPsled.
The figure below shows conceptually what we need to do to implement an overflow:
-
The first stack layout shows a well-formed input without any buffer overflow
-
The second stack layout shows the
char buffilled with a string ofAs that is much larger than the size of the buffer overflowing into theebpandeipregions of memory. this will cause a segfault when we try to runstackwith such an input. -
In the third stack layout we instead judiciously craft our buffer to contain both our shellcode and the hijacked
eipvalue pointing to our shellcode.
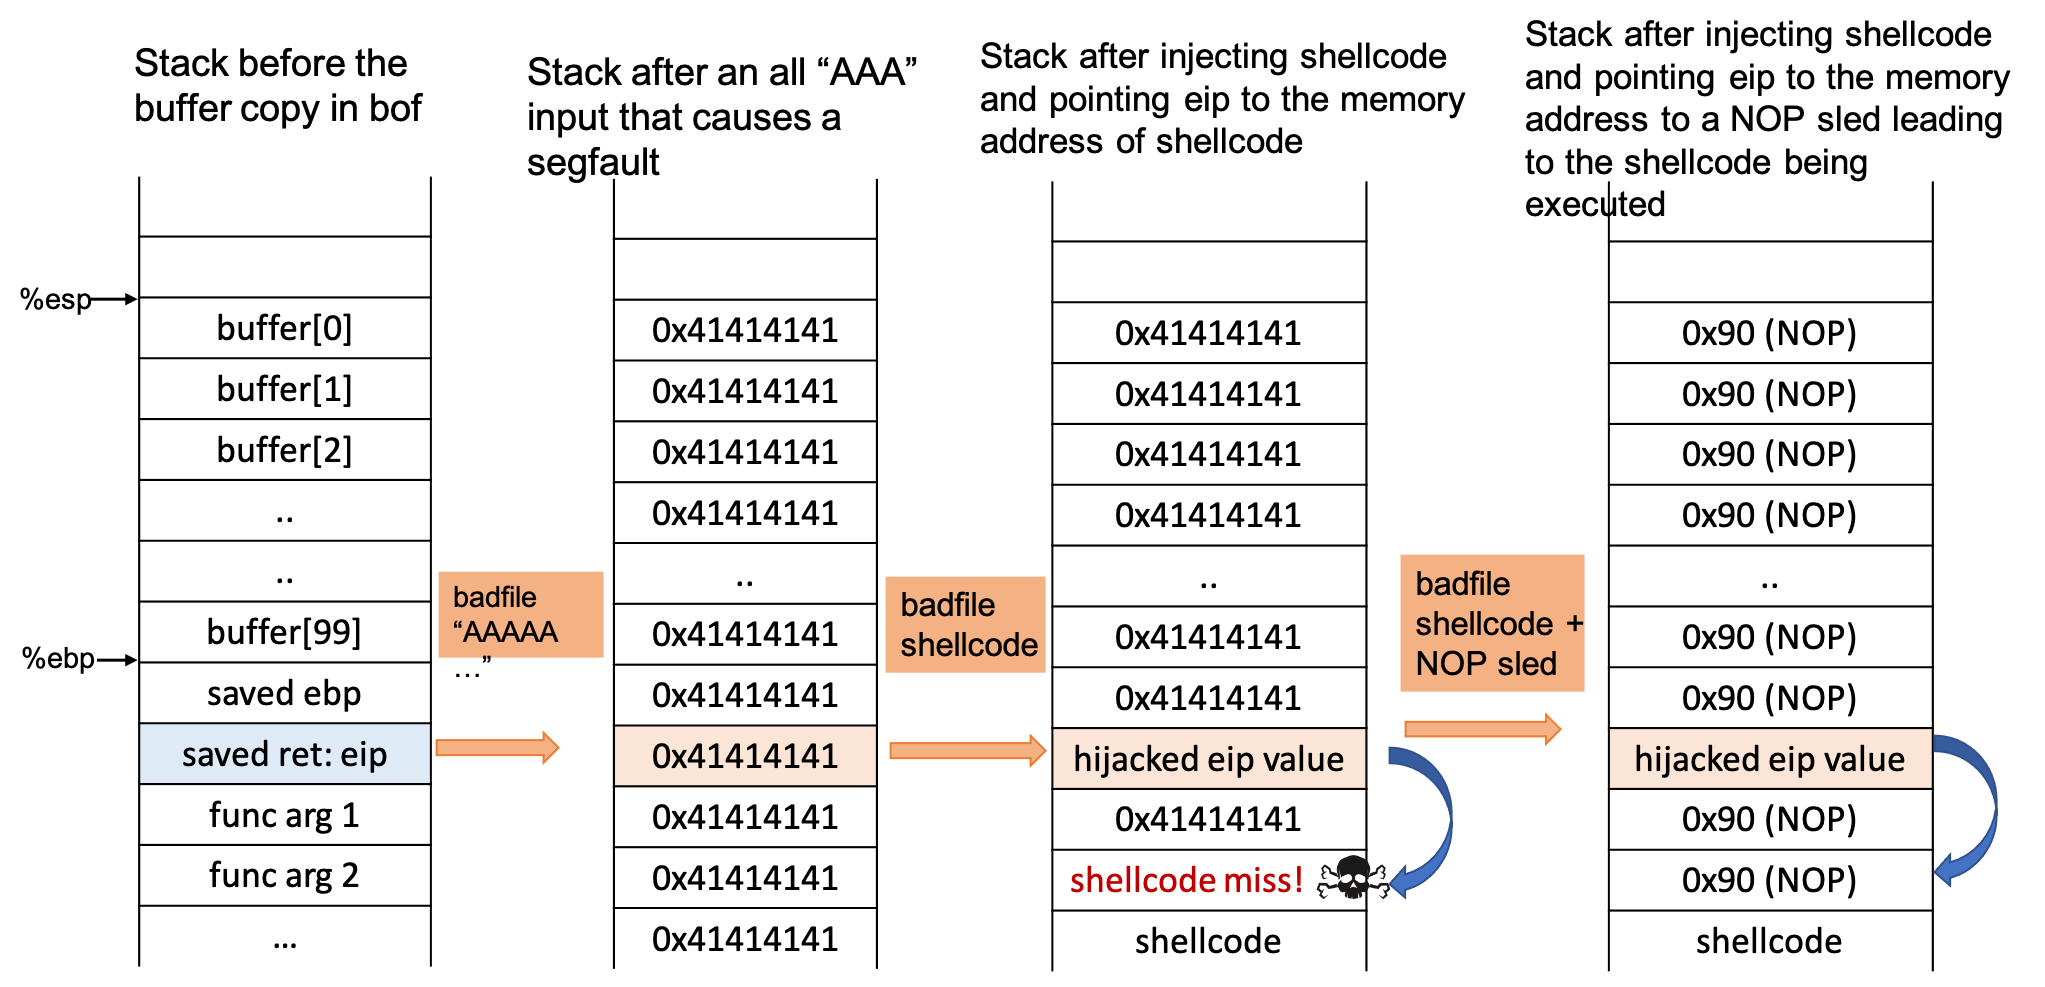
From the third stack diagram it looks like we weren’t successful in redirecting eip to the start of our shellcode. what do you think is happening here? Is there a reason we might not know the exact memory location of where shellcode is in main memory?
|
It turns out that locating exactly where variables are located on the stack (even without address layout randomization), may not be completely deterministic. One of the factors we have to take into account is, since we are using gdb to figure out where buffer starts in main memory, this address might look different when we run stack-L1 outside of gdb. gdb deepens the stack by adding additional information to help with debugging.
You might then be wondering how we can say with confidence that eip is at a fixed location, if we don’t know where char buffer is. That’s a great question!
You are absolutely right - we don’t know absolute locations but we do know relative locations - i.e., eip is always at a fixed offset from the start of char buffer!
-
Going back to constructing our attack - in the fourth stack layout we get smarter with our attack and instead of all
As, we add NOP instructions. ANOPis essentially aNo Operationinstruction, that tellseipto skip to the next instruction - you can see how useful this is! We can create what’s called a NOP sled, that allowseipto "sled" all the way to our shellcode. This way, even if we haveeippoint to a memory address above our shellcode we are guaranteed to get to the start of our shellcode using the "NOP Sled".
| You are now ready to start constructing your payload for level-1! As described below levels 2-4 build on level-1, but essentially follow the same concept. |
Understanding each of the levels of the lab.
-
Level 1 In level 1 we turn of address randomization, and launch a buffer overflow attack, using a
char buffer[]of size 100. And our task is to craft our attack as described above. Craft your attack inexploit-L1.pyand save it inbadfile-L1. -
Level 2 In level 2, we are going to assume that we don’t know the size of
char buffer[]— a much more realistic setting for buffer overflows. Your task is to assume that the buffer size is between 100 - 200 bytes, and to craft your attack such that it will succeed for any buffer size in this range. Craft your attack inexploit-L2.pyand save it inbadfile-L2. -
Level 3 In level 3, we re-enable address randomization. In this attack you can assume that
char buffer[]has a fixed size of 100. Your task is to updatebrute_force.shto launch the attack. Record how long it takes for your code to successfully launch the shell prompt. -
Level 4 In level 4, we disable address randomization again, and in this attack we have a
char buffer[]that is 10 bytes long. Clearly not enough memory to fit in our shellcode andeip! Your task is to successfully launch the attack, despite the small buffer size. Craft your attack inexploit-L4.pyand save it inbadfile-L4.
Debugging and experimenting with stack.c
While trying to figure out how to construct your attack, you might want to make changes to the code stack.c. Note that any changes to the code stack.c will change its layout in memory! It’s completely fine to make these changes, just remember to restore stack.c to the original version after you are done experimenting and testing. Your lab will be graded on the original code for stack.c so you should make sure your attack works on this version.
|
Setting up your VM
For the rest of this course, we will use a Virtual Machine to run our lab assignments.
A Virtual Machine creates a "virtual" instance of everything that a physical machine like a desktop or laptop computer has. This includes virtual instances of the hardware — RAM, hard-disk space, number of CPUs cores, network ports, and we can even create virtual "USB" ports! On top of this virtual hardware, we can install an O.S of our choosing (such as Windows, MAC O.S. or Linux), and include system libraries and software that we want pre-packaged into our VM. Once the VM is built, we can package it into a single shareable file. Software like VirtualBox and VMWare are popular platforms to create and run Virtual Machines. If we have multiple VMs - we can even connect them up to form a virtual network.
VMs are excellent for testing new features, learning penetration testing and hacking, and also for research purposes. We can create exactly reproducible environments, complete with system dependencies - allowing for other folks to understand, build or patch the vulnerabilities/features in the exact same environment that we have used. VMs also provide us with a sand-boxing - i.e., creating a safe-environment in which to conduct security experiments that’s both fast, and cost-effective. Corrupting data or code in a controlled environment like a VM is not as severe a risk as loosing the data on your physical machine!
Please read the instructions below carefully. Failing to do so will use up your disk space in your home directory. Note that the VM image will NOT fit in your home directory - you will need to work in /local which is the local hard disk of the machine you are using. You might want to write down the name of the CS machine you are using for your record.
|
To get started, you’ll need to import a copy of the starter VM image:
-
Run
virtualboxin a terminal or open it from the graphical menu. -
Go to File → Preferences, set your
Default Machine Folderto\local, then close the preferences window. -
Go to File → Import Appliance. Choose:
/local/CS88-Ubuntu20.04.ovaand push next once. -
You should now see Appliance Settings.
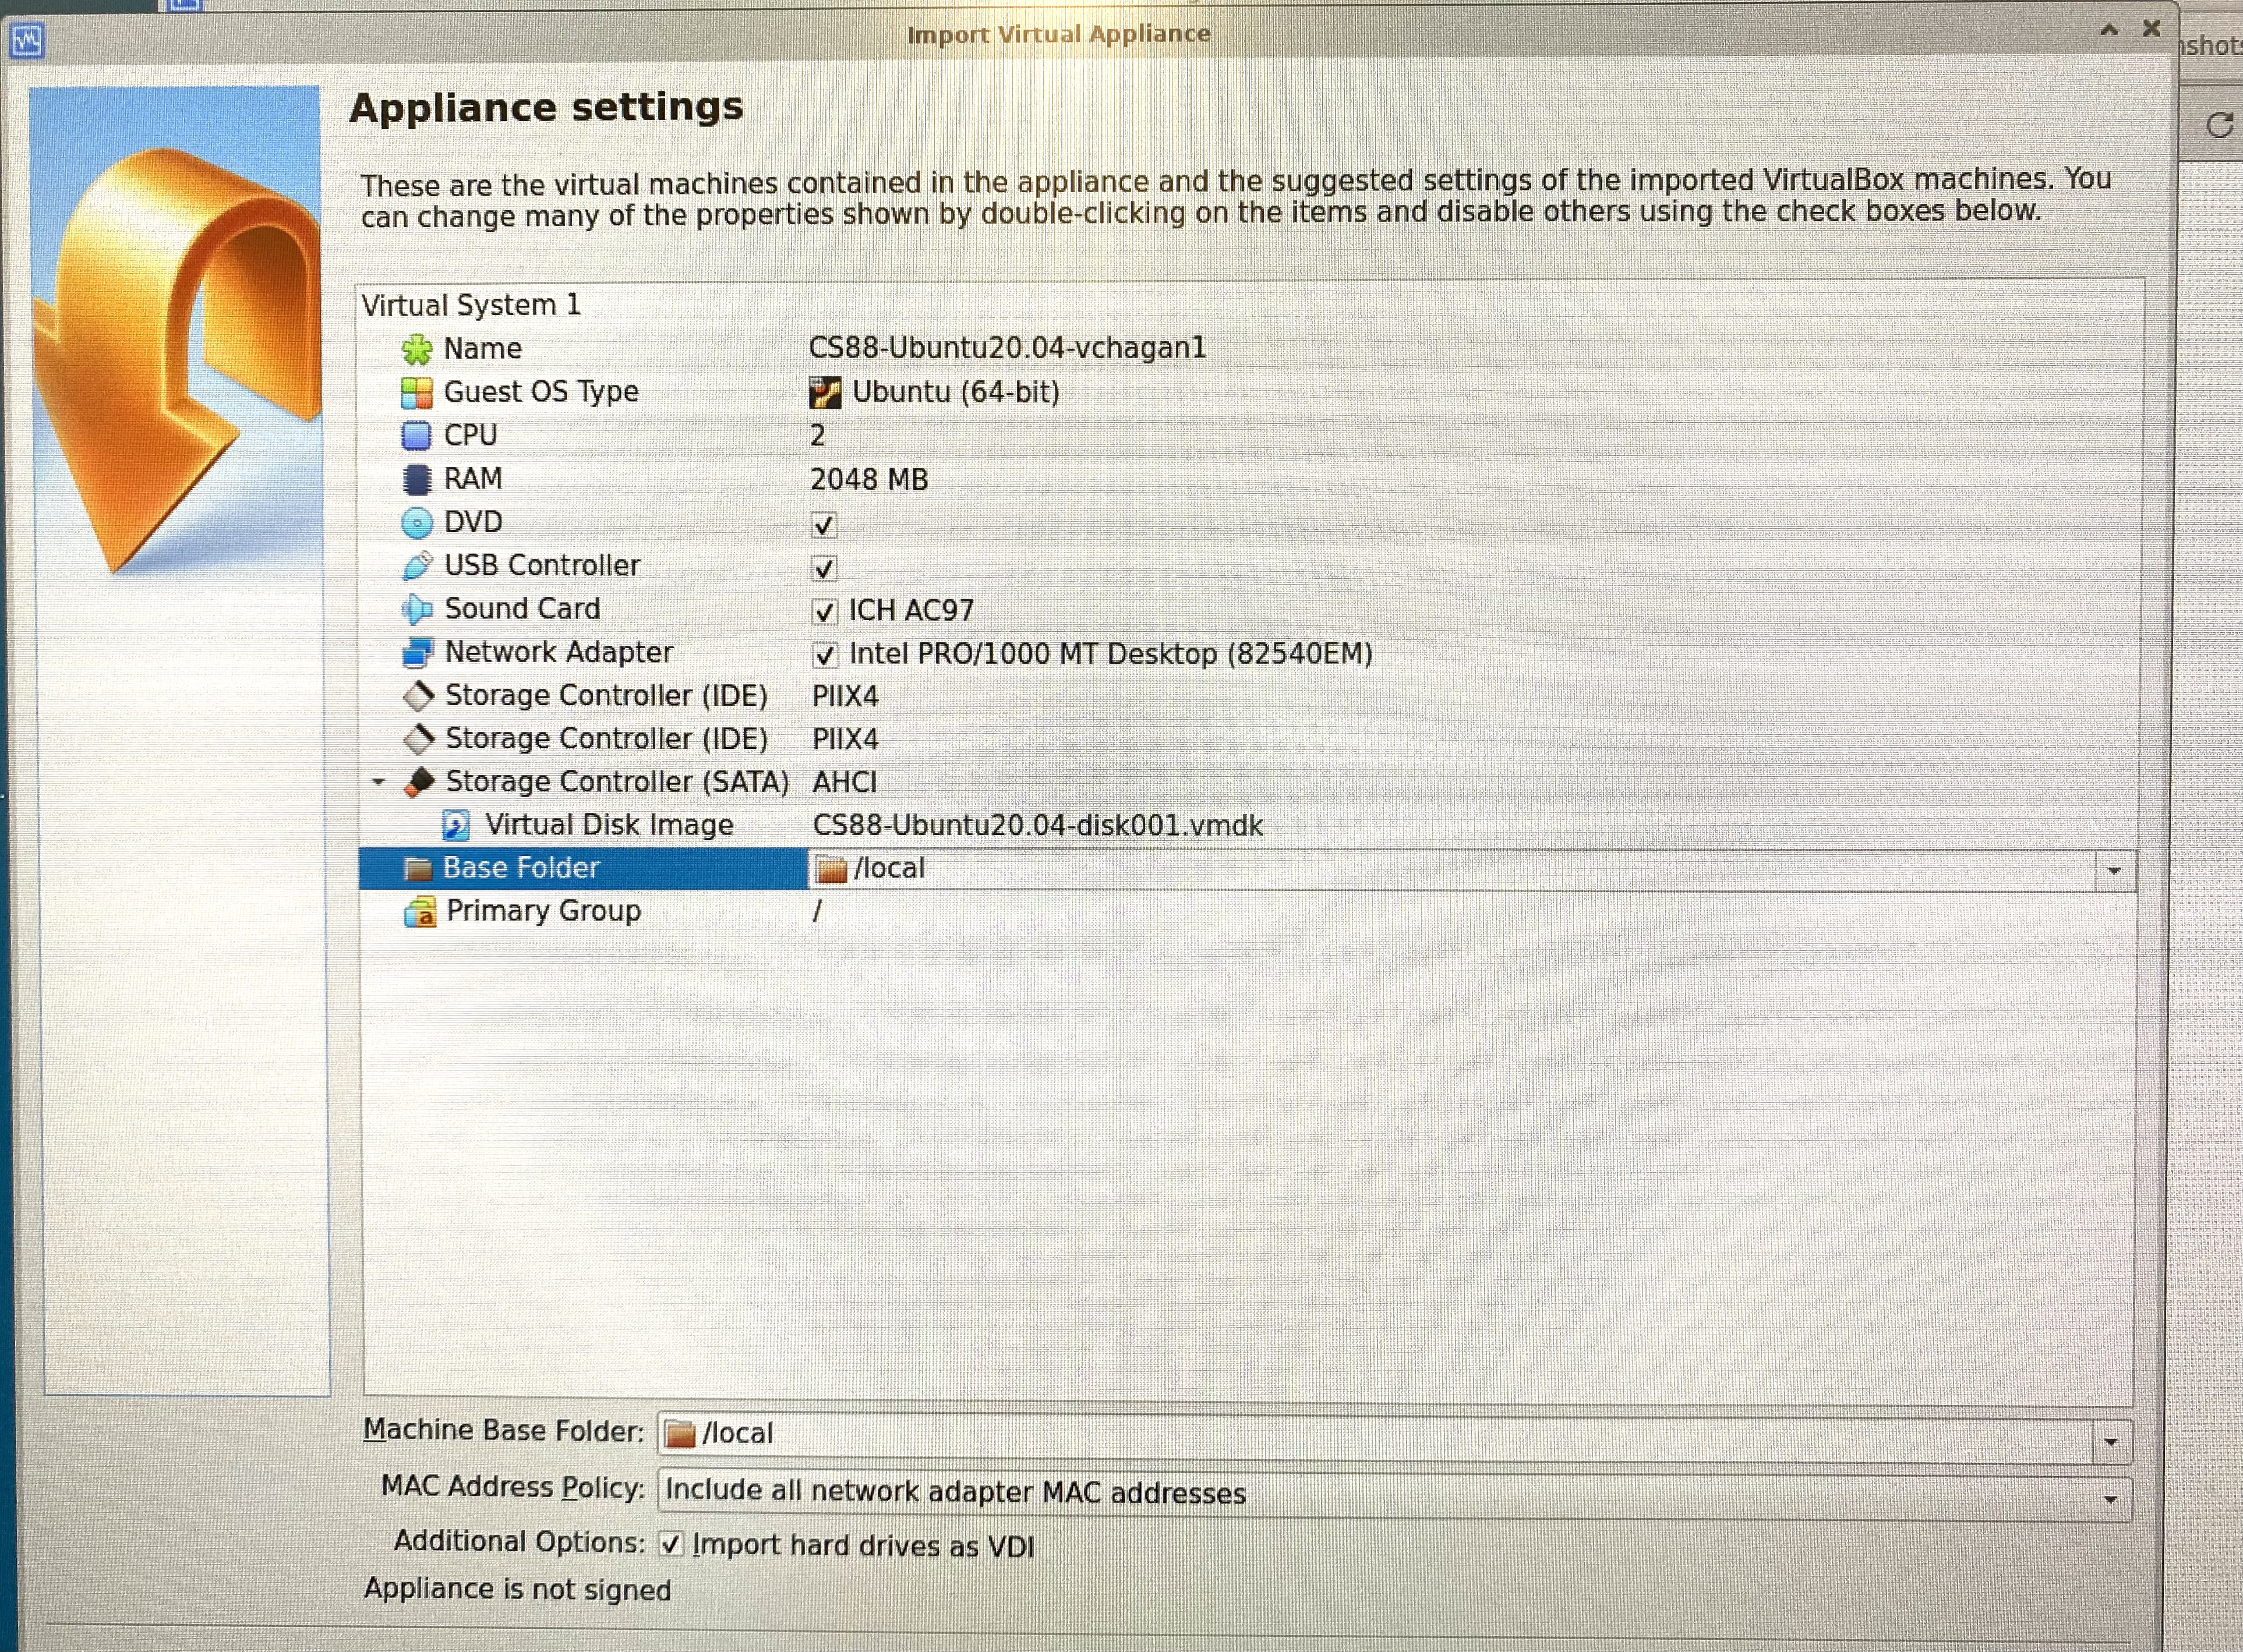
-
Edit the name to include your username. For example:
CS88-Ubuntu20.04-username1-username2. -
Edit the number of CPUs to 2.
-
Ensure the Base Folder is set to
/local.-
You should now be all set. Wait for the OS to boot, and then you should see a prompt to enter your username and password.
username: seed password: dees -
Change Password: Please change the password on your VM to something you and your partner remember! You can change the password as follows: open the terminal, and enter
passwd:
-
seed@VM:~$ passwd
Changing password for seed.
Current password:
New password:
Retype new password:
passwd: password updated successfully
Setup PortForwarding for your VM
We will also setup Port Forwarding for your VM so that we can remote login to the virtual machine from the CS machine.
-
Go to File→ Preferences and click on Network. Here you should see
NatNetworkselected. In here, select the third green button highlighted in the figure below, that says "Edit selected NAT Network".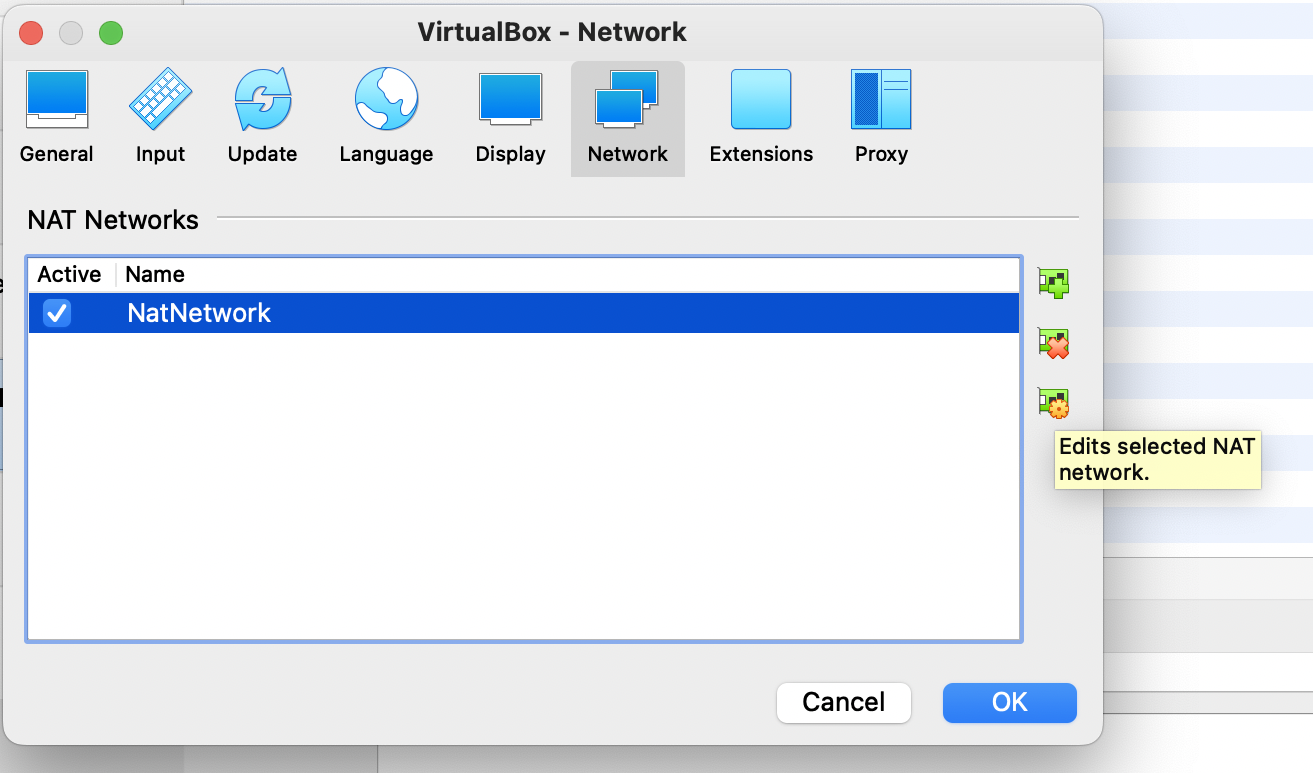
-
Next, you should see a pop-up where you can click "Port Forwarding".
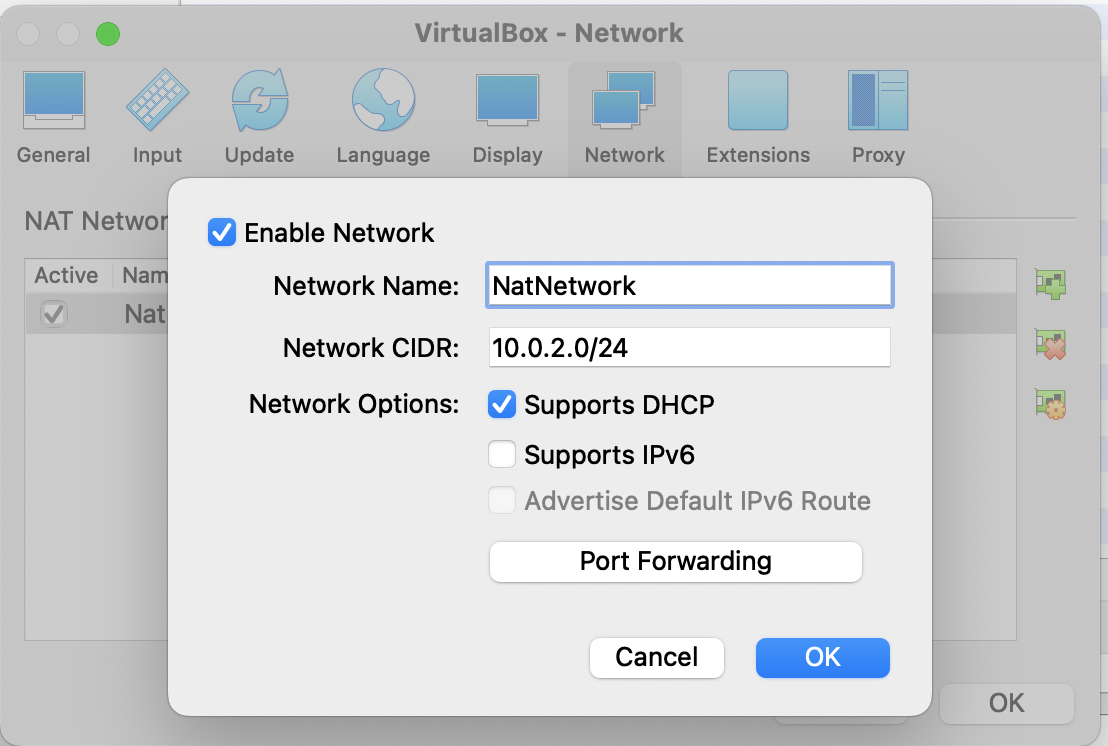
-
Make sure that the rule you enter matches the figure below. Select TCP, with Host Port set to
2222, and Guest IP set to10.0.2.4and Guest Port set to22. Finally, click OK.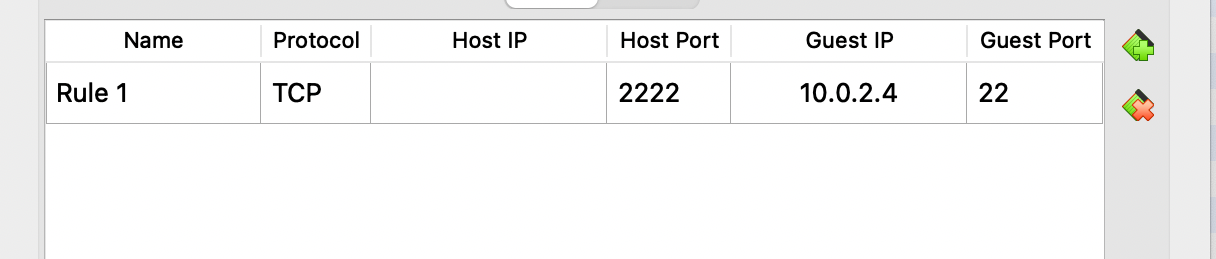
-
Verify that port forwarding works:* You can run the following command to connect to the
seedVM$ ssh localhost -p 2222 -l seedIf you would like to copy data back and forth between your VM and the CS machine you can use
scpas follows. Quick note here that copying files into yourgithubfolder that# to copy data back and forth # scp -P 2222 <source> <destination> # example below: $ scp -P 2222 seed@localhost:/home/seed/Documents/Labs/file-to-copy lab1/*
| Congratulations! You’re now all set to work on your VM. Please note that you will get frequent prompts to install updates. Please ignore all such prompts - do not install updates as that will change the environment that has been specifically chosen for this class. This is not a reversible change. If you have installed updates, you might have to setup a new VM from scratch and redo all of the setup steps. |
Setup SSH keys for Github
We now want to be able to setup SSH-keys to use github on our VM.
-
To do so, create a new key for the VM and add it to your GitHub account. (Instructions)
-
Once you are all set you should be ready to
git cloneyour lab repo.
| All your work on the VM should be committed to github. Leaving your work on the VM without any backup is extremely unreliable and can result in the loss of many hours of work! |
Working remotely on your VM
-
To turn on your VM remotely from terminal, first
sshinto the machine where you setup your VM, andcdinto/localand list your vm$ ssh username@<CS_machine>.cs.swarthmore.edu $ cd /local $ vboxmanage list vms
-
Locate your VM name in the
vm-listand run the following command to start your VM in headless mode.$ vboxheadless -startvm CS88-Ubuntu20.04-username1-username2
-
Once you run this command, the terminal will no longer be available to type in. You should open a new terminal and ssh into your
CS_machineto interact with the VM. -
When you’re done working on your VM, you should shut it down nicely:
sudo shutdown -h now.
Miscellaneous hints
| Good systems programming and reverse engineering involves: |
-
use gdb to incrementally walk through your code and provide input
-
use a piece of paper to draw out the stack
-
locate the addresses on the stack
-
repeat step 1
Grading Rubric
This lab is worth 8% that is going to be graded as follows:
-
2 points for attack level 1
-
2 points for attack level 2
-
1 point for attack level 3
-
1 point for attack level 4
-
1 points for completing
lab1-worksheet.adoc -
1 point for completing
lab1-checkpoint.adoc*
Submitting
Please remove any debugging output prior to submitting.
To submit your code, simply commit your changes locally using git add and git commit. Then run git push while in your lab directory.