CS21 Lab 9: Searching and Data Visualization
For this lab you will write one program, city_rank.py, that lets the user explore population and income data for many large- to medium-sized metropolitan areas in America. You will also explore a gentle introduction to the fabulous Matplotlib library for visualizing data (drawing graphs). Finally, this lab also has a "written" component that you will answer in a file called search_analysis.txt.
First, run update21, if you haven't already, to create the cs21/labs/09 directory. Then cd into your cs21/labs/09 directory and create the python program for lab 9 in this directory
This lab is not specifically focused on design or testing methods, but you should continue to use the good practices you have learned, like top-down design and commenting functions.
In this lab you will write a program that lets a user explore a relatively small data set that includes the following information about several U.S. metropolitan areas:
- Name
- Population in 2010
- Population in 2012
- Median household income
In addition to these four pieces of information, your program should compute a derived metric for each city: population growth. The formula for this is:
100.0 * (pop_in_2012 - pop_in_2010) / pop_in_2010
(Multiplying by 100 makes the number a percentage.)
Here is full name of the file and it's first few lines. The format is "Name:2010 population:2012 population:Median income".
/usr/local/doc/dem/cities.txt
Hickory-Morganton-Lenoir, North Carolina:365497:363627:37818
San Angelo, Texas:111823:114854:33148
Fort Walton Beach, Florida:235865:247665:41474
Roanoke, Virginia:308707:310118:39288
Note that we used : characters to separate the values because commas appear in some of the metro area names.
Your program should introduce itself and take query commands from the user. Here is an example interaction:
$ python city_rank.py
Welcome to the city data set.  The queries you can make are:
    List all cities whose names match a simple pattern
    Find the city whose 2010 population is closest to a given value
    Find the city whose 2012 population is closest to a given value
    Find the city whose population growth is closest to a given value
    Find the city whose median household income is closest to a given value
    Make some shiny plots

What's your command?
  (L) List cities    (0) 2010 pop  (2) 2012 pop  (G) Growth
  (M) Median income  (P) Plots     (Q) Quit
? L
What pattern should I look for in city names? af
Flagstaff, Arizona
  2010:  134421  2012:  136011  growth: 1.183  median:$ 37971
Lafayette, Indiana
  2010:  201789  2012:  206412  growth: 2.291  median:$ 39072
Lafayette, Louisiana
  2010:  466750  2012:  474415  growth: 1.642  median:$ 30998

What's your command?
  (L) List cities    (0) 2010 pop  (2) 2012 pop  (G) Growth
  (M) Median income  (P) Plots     (Q) Quit
? 0
What 2010 population are you interested in?  120000
Sherman, Texas - 2010: 120877

What's your command?
  (L) List cities    (0) 2010 pop  (2) 2012 pop  (G) Growth
  (M) Median income  (P) Plots     (Q) Quit
? 2
What 2012 population are you interested in?  120000
Bismarck, North Dakota - 2012: 120060

What's your command?
  (L) List cities    (0) 2010 pop  (2) 2012 pop  (G) Growth
  (M) Median income  (P) Plots     (Q) Quit
? G
What 2010-2012 population growth percentage are you interested in?  1.2
Flagstaff, Arizona - growth: 1.183

What's your command?
  (L) List cities    (0) 2010 pop  (2) 2012 pop  (G) Growth
  (M) Median income  (P) Plots     (Q) Quit
? G
What 2010-2012 population growth percentage are you interested in?  -0.2
South Bend, Indiana - growth: -0.200

What's your command?
  (L) List cities    (0) 2010 pop  (2) 2012 pop  (G) Growth
  (M) Median income  (P) Plots     (Q) Quit
? g
What 2010-2012 population growth percentage are you interested in?  a little
Sorry, a little doesn't make sense as a population growth

What's your command?
  (L) List cities    (0) 2010 pop  (2) 2012 pop  (G) Growth
  (M) Median income  (P) Plots     (Q) Quit
? M
What median household income (in dollars)?  40000
Bellingham, Washington - median: $40005

What's your command?
  (L) List cities    (0) 2010 pop  (2) 2012 pop  (G) Growth
  (M) Median income  (P) Plots     (Q) Quit
? m
What median household income (in dollars)?  50000
New London, Connecticut - median: $49283

What's your command?
  (L) List cities    (0) 2010 pop  (2) 2012 pop  (G) Growth
  (M) Median income  (P) Plots     (Q) Quit
? sdfgsdg
I'm sorry.  Command sdfgsdg doesn't make sense.

What's your command?
  (L) List cities    (0) 2010 pop  (2) 2012 pop  (G) Growth
  (M) Median income  (P) Plots     (Q) Quit
? Q
Thanks for your patronage.  Have a nice day.
These kinds of command interfaces are more convenient when they are case-insensitive. You should do that by calling the upper() method on the command string that the user types.
The details of what you need to implement are discussed below.
For this lab you will need to sort a list of lists by a certain element of the sub-lists. You should use Python's built-in sorted function and the itemgetter function from the operator library. Here is an example of how to use them.
from operator import itemgetter

items = [[1, 2, 3], [-1, 7, 9], [2.3, -20, 21], [7.9, 23, -42]]
items_sorted_by_0 = sorted(items, key=itemgetter(0))
items_sorted_by_1 = sorted(items, key=itemgetter(1))
items_sorted_by_2 = sorted(items, key=itemgetter(2))
print "0:", items_sorted_by_0
print "1:", items_sorted_by_1
print "2:", items_sorted_by_2
This is what you should see if you run this code:
0: [[-1, 7, 9], [1, 2, 3], [2.3, -20, 21], [7.9, 23, -42]]
1: [[2.3, -20, 21], [1, 2, 3], [-1, 7, 9], [7.9, 23, -42]]
2: [[7.9, 23, -42], [1, 2, 3], [-1, 7, 9], [2.3, -20, 21]]
Some explanation of what's going on in this code:
- sorted is a built-in function that takes a list as a parameter and returns a new list that is sorted from least to greatest.
- By default, sorted uses the built-in Python comparison operation to decide which items are "less" or "greater".
- You can change sorted's ordering behavior by supplying your own comparison function. Using the optional key parameter and the itemgetter function is one example of how to do that.
You should use this technique to produce three versions of the city data: One sorted by name, one sorted by population growth and one sorted by income. We chose to make these sorted versions because we assume that these are going to be the most popular kinds of queries and it's worth investing time in sorting for these metrics.
When the user makes a name query, your program should prompt them for a pattern. Your program should output all the cities whose names contain the pattern given by the user. (This is a very simple kind of pattern.) For checking whether the pattern is in a particular city name, you may use Python's built-in in operator.
Because you have a version of the data that is sorted by city name, you should print the names in alphabetical order.
For the other four kinds of queries, you will implement variations on the linear and binary searches that we covered in lecture. Instead of returning True or False, these versions should return the item from the input list that is closest to the value we are searching for. To make things a bit more interesting, these search functions should expect not a plain list of items, but rather a list of lists. Your search function should take another parameter that we will call the "column index". When doing the search, your code should compare the value you're searching for the "column index" item of the sub-list. Here is an example of this function in action:
items = [[1,20,250],[4,42,390],[9,90,1000]]
item1 = linear_search_closest(100, items, 0)
# item1 == [9,90,1000]
To understand how linear_search_closest is supposed to work, notice that the "column-0" values in this example are 1, 4 and 9. Of those, the closest to 100 is 9, which is why we choose [9,90,1000]. Here are some more examples:
item2 = linear_search_closest(35, items, 1)
# item2 == [4,42,390]
items3 = linear_search_closest(300, items, 2)
# item3 == [1,20,250]
Notes:
- If your search functions are passed an empty list, they should return the built-in Python object None (you can do this by simply writing return None).
- Your binary search function should assume that the input list of
lists is sorted by the column that the caller is asking to search on.
For example, the following call may or may not return the closest row,
because the sub-lists are not ordered by the index-1 value:
items = [[1, 7],[3, 100],[9, 20]]
who_knows_what = binary_search_closest(25, items, 1)
- In the previous section it was stated that you should make lists that are ordered according to specific rows. When you are searching, you should use the binary search if the appropriately-ordered data is available. If no such ordered data exists, fall back to linear search.
- It is possible that more than one row will be equally close to the target value. In this case, choose the row with the earliest name, alphabetically.
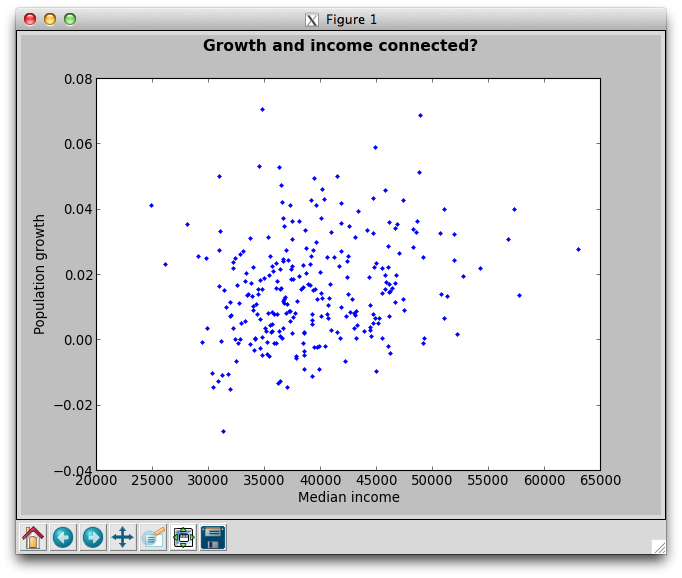
The P command (P for Plot) should use Matplotlib to show a couple of interesting scatter plots. The starter code we give you shows how to invoke the library. The first plot shows all the cities with median income on the horizontal axis and population growth on the vertical axis.
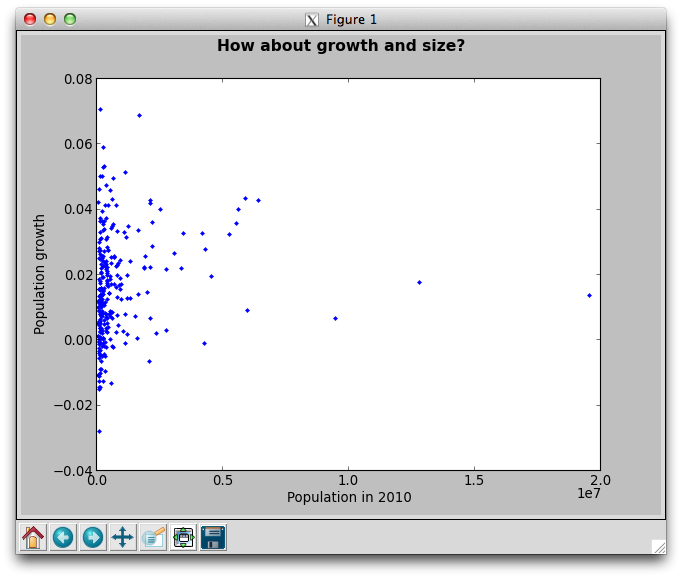
The second plot shows all the cities with 2010 population on the horizontal axis and population growth on the vertical axis.
In order to make these plots, you need to extract individual "columns" from your city data. In the starter code we provide a function called extract_column that will do this for you. For example:
items = [[1,2,3],[4,5,6],[7,8,9]]
extract_column(items, 1) == [2,5,8]
There no additional user inputs for this command. Your program should just produce these two specific plots.
As discussed in lecture, binary search is much more efficient than linear search, with two caveats: (1) The list must already be sorted for binary search to work. (2) For very short lists it's harder to say which algorithm is faster. In this exercise, you will quantify the performance difference between the two.
Make the following assumptions:
- We have an unsorted list of 256 items.
- Sorting the list costs 4480 time units. (We will see soon in class why this a reasonable approximation for the cost of sorting.)
- Each loop iteration of a linear search costs 1 time unit.
- Each loop iteration of a binary search costs 4 time units. (The cost difference here is an acknowledgment that the code for binary search is more complex than the code for linear search.)
If you only want to do one search in the list, it's clearly not worth sorting the list then running binary search, because the cost of sorting is far higher than the cost of a single linear search.
How many searches for items that are not in the list would you have to do to make sorting and using binary search a better strategy than using linear search? (We specify searching for items that aren't in the list because it makes the math simpler. If an item is in the list it's hard to predict exactly how many steps a particular search will take.)
Write your answer in the file search_analysis.txt. Write down a few sentences to explain how you calculated your answer. Do not write any code for this section.
If you find yourself with extra time this week, try out some of the Matplotlib tutorials. Data visualization is one of the exciting and important things that lots of people in other fields are using computers for these days. Matplotlib is actually used quite extensively by data analysts.
You may run handin21 as many times as you like, and only the
most recent submission will be recorded. This is useful if you realize,
after handing in some programs, that you'd like to make a few more
changes to them.