


In this lab you will explore unsupervised learning, specifically k-means clustering and agglomerative hierarchical clustering. You have been given a file called clustering.py that defines a base class with some common methods that read in data and calculate distance. You will be modifying the starting point files: hierarchical.py and kmeans.py.
Some sample data files have been provided. The ClusteringModel class expects the data to be in the following format:
The data provided includes:
0.9 0.8 0.1 a1
0.9 0.1 0.6 b1
0.1 0.1 0.1 c1
0.8 0.9 0.2 a2
0.8 0.0 0.5 b2
0.0 0.0 0.2 c2
0.9 0.9 0.3 a3
0.2 0.0 0.0 c3
0.5 0.5 0.5 d1
The a points are close to (1,1,0); the b points are close to (1,0,0.5); the c points are close to (0,0,0); and the d point is an outlier. A "good" clustering of these points would group the a's, the b's, and the c's separately.
Once you have implemented the following clustering methods, you will also pick your own data set to explore with them and analyze the results using the latex template provided with the starting point.
Execute the base class defined in clustering.py. Make sure you understand what class variables it creates. Note that it converts the points into numpy arrays to more efficiently calculate Euclidean distances.
You will implement k-means clustering in the kmeans.py file. The random data set will be particularly useful for testing k-means.
The k-means algorithm partitions the data into k clusters, where each cluster is defined by a center point. The goal is to minimize the distance between each centroid and the data points that are closest to it. The algorithm begins with an initial partitioning and then iteratively improves it until no further progress can be made.
The following data structures will be helpful in implementing the algorithm:
The following pseudocode describes the algorithm:
init k centroids to be random points from the data set
init members and labels to be empty dictionaries
while points change clusters:
   init each cluster's member list to be empty
   # E step
   for each point in the data set
      assign point to the closest centroid, updating members and labels
   # M step
   for each cluster
      update the centroid to the average of its assigned points
There is a rare edge case that also needs handling, where one of the clusters will end up with no points assigned to it, and therefore no centroid.
If this happens, you should re-initialize that centroid to a random data point, and run a new E step to reassign the data points.
Below is a trace of one execution of k-means on the small.points data that uses the showClusters method to print information about each cluster and its members. In the first iteration, points c3, a2, and a3 were selected as the initial centroids.
ITERATION 1
Current error: 2.8477734056
--------------------
Center: c2 Length: 4
Center point: 0.200 0.000 0.000 c3
0.100 0.100 0.100 c1
0.800 0.000 0.500 b2
0.000 0.000 0.200 c2
0.200 0.000 0.000 c3
--------------------
Center: c1 Length: 3
Center point: 0.800 0.900 0.200 a2
0.900 0.800 0.100 a1
0.800 0.900 0.200 a2
0.500 0.500 0.500 d1
--------------------
Center: c0 Length: 2
Center point: 0.900 0.900 0.300 a3
0.900 0.100 0.600 b1
0.900 0.900 0.300 a3
In the next iteration, the error drops, and several of the points have shifted clusters (a3, b2, and d1).
ITERATION 2
Current error: 2.72339291187
--------------------
Center: c2 Length: 3
Center point: 0.275 0.025 0.200
0.100 0.100 0.100 c1
0.000 0.000 0.200 c2
0.200 0.000 0.000 c3
--------------------
Center: c1 Length: 3
Center point: 0.733 0.733 0.267
0.900 0.800 0.100 a1
0.800 0.900 0.200 a2
0.900 0.900 0.300 a3
--------------------
Center: c0 Length: 3
Center point: 0.900 0.500 0.450
0.900 0.100 0.600 b1
0.800 0.000 0.500 b2
0.500 0.500 0.500 d1
In the final iteration error drops again, but none of the points have moved clusters, so the program ends.
ITERATION 3
Current error: 1.46750698081
--------------------
Center: c2 Length: 3
Center point: 0.100 0.033 0.100
0.100 0.100 0.100 c1
0.000 0.000 0.200 c2
0.200 0.000 0.000 c3
--------------------
Center: c1 Length: 3
Center point: 0.867 0.867 0.200
0.900 0.800 0.100 a1
0.800 0.900 0.200 a2
0.900 0.900 0.300 a3
--------------------
Center: c0 Length: 3
Center point: 0.733 0.200 0.533
0.900 0.100 0.600 b1
0.800 0.000 0.500 b2
0.500 0.500 0.500 d1
--------------------------------------------------
Centers have stabilized after 3 iterations
Final error: 1.46750698081
Remember that each run of k-means will be different. The algorithm is very sensitive to the initial conditions. The final assignments found in this particular run are the most common, but other assignments will also occur.
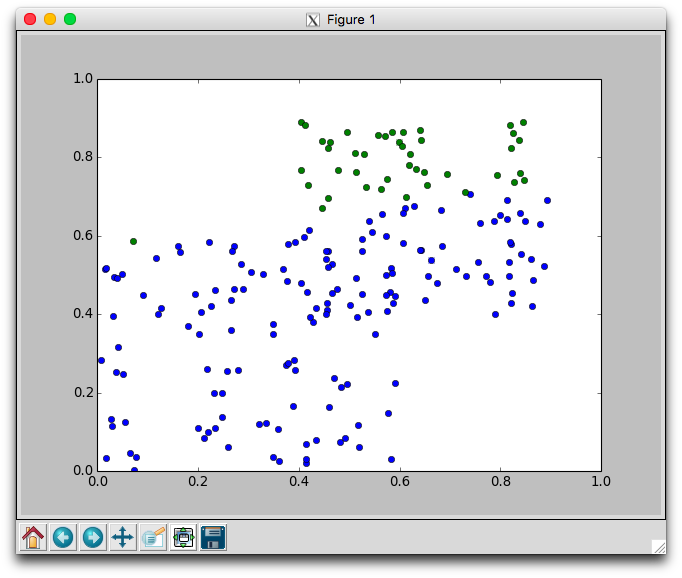
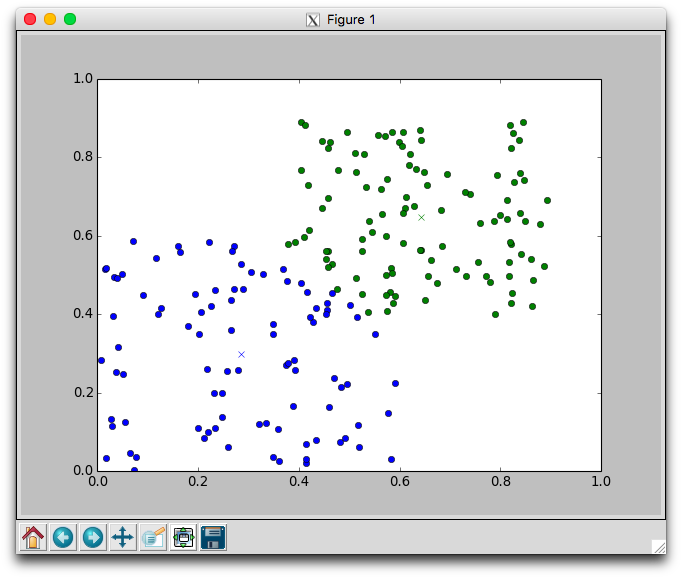
With two dimensional data we can plot the movement of the centroids and the assignment of points to clusters. Using the plotClusters method we can watch how the clusters evolve over time. After each iteration a plot will appear. The plot shows the centroids as x's and the members as circles. Each cluster is color coded. You'll need to close the plot to continue to the next iteration.
Below is one run with k=2 using the random data that required 8 iterations to stabilize. Notice that the green cluster was initially quite small and over time grew downwards.
Try different different values for k on the random data. Recall that one of the issues with using k-means is that it is not always clear how to appropriately set k. Larger k will reduce error, but may create clusters that are over-fitted to the data.
Be sure to discuss how you chose k when you applied k-means to your own data set.
You will perform agglomerative clustering, constructing the tree from the bottom up. Let's walk through the steps using the small data set described above.
Use a dictionary that maps a cluster's label to the cluster's average point (average link). The cluster's label will represent the tree structure that has been created so far. The leaves will simply be the point labels. Internal nodes will be tuples of the form:
(clNUM, leftBranch, rightBranch)
('cl0', 'a3', 'a2')
a1
b1
b2
c3
c2
c1
d1
('cl0', 'a3', 'a2')
('cl1', 'b1', 'b2')
a1
c3
c2
c1
d1
('cl0', 'a3', 'a2')
('cl1', 'b1', 'b2')
a1
('cl2', 'c2', 'c1')
c3
d1
('cl3', ('cl0', 'a3', 'a2'), 'a1')
('cl1', 'b1', 'b2')
('cl2', 'c2', 'c1')
c3
d1
('cl4', ('cl2', 'c2', 'c1'), 'c3')
('cl3', ('cl0', 'a3', 'a2'), 'a1')
('cl1', 'b1', 'b2')
d1
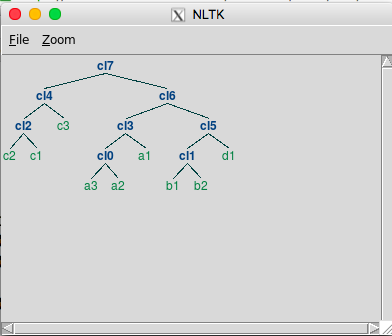
('cl7', ('cl4', ('cl2', 'c2', 'c1'), 'c3'), ('cl6', ('cl3', ('cl0',
'a3', 'a2'), 'a1'), ('cl5', ('cl1', 'b1', 'b2'), 'd1')))
This tuple reflects the tree structure, but it can be hard to see the structure in this format. Using the plotTree method will generate a picture like this:
Implement this bottom-up process now in the file hierarchical.py. Calculating distances is the bottleneck of this process, so be sure to store all calculations in the self.distances dictionary. Then you can check this first whenever a distance is needed. If it's there, use it, if not generate it and store it.
Once you can successfully create a hierarchical cluster for the small data, try the subset data next, and finally the full digits data. Drawing the tree for the full data will take some time. Based on the final tree, which digits seem to be easier (and harder) for the network to classify?
In lecture, we will consider several alternatives for measuring the similarity of (or distance between) two points. You are encouraged to test some of these alternatives. As a first step, try replacing Euclidean distance with Manhattan distance. Remember, Manhattan distance is equivalent to the 1-norm, so we can add a ManhattanDist function to clusteringModels.py that will look very similar to the EuclideanDist function that has already been defined. To use the new function, you'll need to replace the following line from UnsupervisedLearning.__init__:
self.dist = self.EuclideanDist --> self.dist = self.ManhattanDist
You should also be sure that your kmeans and hierarchical implementations call self.dist instead of self.EuclideanDist You can also try out clustering with other distance or similarity measures.
Find a data set that you are interested in exploring using unsupervised learning. A good place to look for inspiration is the UCI Machine Learning Repository.
Apply your implementations of both hierarchical clustering and k-means to your chosen data set. This may require you to do some pre-processing to put the data into the necessary format.
Write up your findings in the provided LaTeX template lab9.tex. To compile it do: pdflatex lab9.tex. To view the result do: gnome-open lab9.pdf.
cd ~/cs63/labs/09
git add *.py *.points *.labels
git commit -m "final version"
git push