CS21 Lab 4: Graphics
First run update21, if you haven't already, to create the cs21/labs/04 directory. Then cd into your cs21/labs/04 directory and create the python programs for lab 4 in this directory (handin21 looks for your lab 4 assignments in your cs21/labs/04 directory):
$ update21
$ cd ~/cs21/labs/04
$ pwd
  /home/your_user_name/cs21/labs/04
Your programs are graded on both correctness and style. Please review the comments regarding programming style on the main page.
For this lab we will be using the
Zelle graphics library.
Write a program called arcs.py that draws the following image in a graphics window:
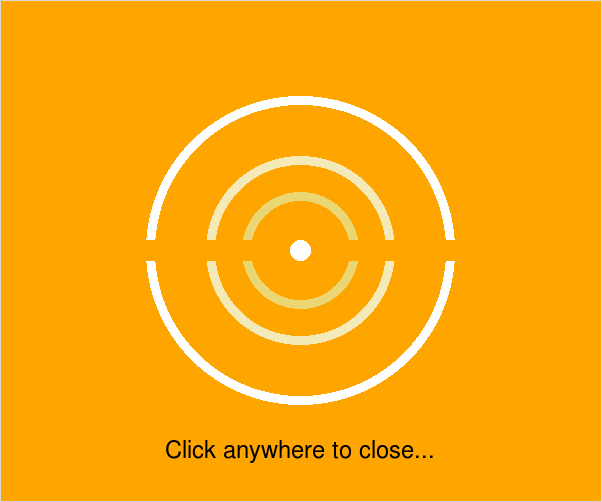
You can choose different colors if you want, but your image should
contain three concentric pairs of arcs around a center circle. Your program should
also display the "Click anywhere to close..." message and wait for
a mouse click from the user before closing the graphics window.
Write a program called shadow_text.py that mimics the common drop-shadow text effect. Your program should first ask the user to enter some text and then display that text with a "shadow". For example, if the user types "we love CS!!", your program should display a window like this:

Again, you may choose different colors if you like (although the
shadow should probably be black). Also, the text should be centered
in the window and the program should wait for a mouse click before
closing.
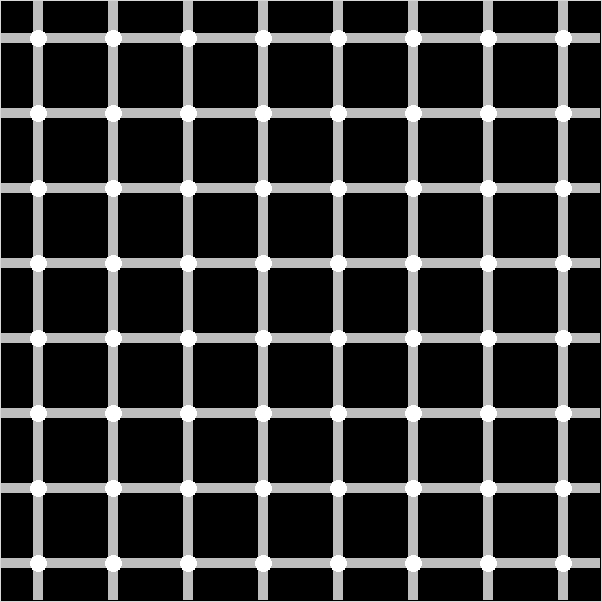
Write a program called illusion.py that draws a pattern of grey lines and black squares like this:
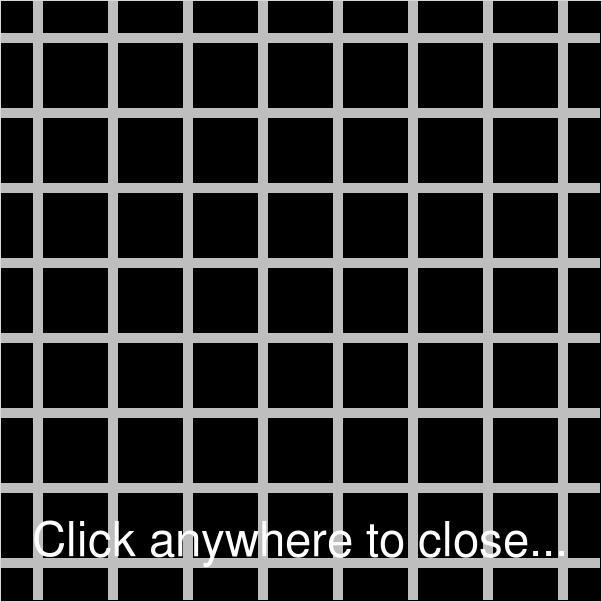
Your program should ask the user for the width of the graphics window and always draw the same number of lines and squares. For this illusion, it works best with black squares and grey lines, so stick with those colors.
Once again (really...always with graphics programs), wait for a mouse
click before closing the window.
Write a program called clicks.py that displays a given image file and then asks the user to click the mouse twice on that image. After each click, display a white dot to show where the user clicked. After you have both mouse clicks, display a line from one point to the other and calculate (and display) the pixel distance between the two points.
Here's how you display an image using the Zelle graphics library:
  # create a window that's the same size as the image
  w = 304
  h = 304
  win = GraphWin("ibm image...", w, h)
  # create center point object
  cp = Point(w*0.5, h*0.5)
  # create image object from IBM image file
  im = Image(cp, "/usr/local/doc/ibm.ppm")
  im.draw(win)
Here are three images from such a program:
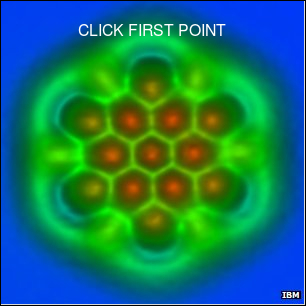
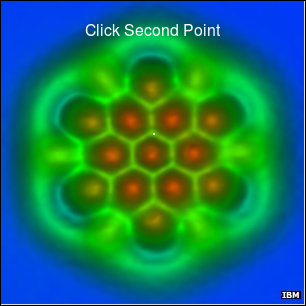
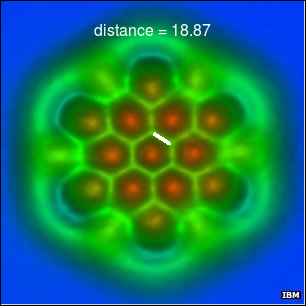
NOTE: to calculate the distance between the two points, you will need the x,y coordinates of each point (e.g., x1,y1 and x2,y2). Once you have those coordinates, the distance between them can be calculated as follows:
distance = sqrt( (x2 - x1)**2 + (y2 - y1)**2 )
These are not part of the lab assignment, but just fun extra problems to challenge you. Please don't try these until you have completed all of the regular problems for this lab. And it's just a fun exercise -- no bonus points or extra credit. :(
1. The inspiration for the first "arcs" problem came from simpledesktops.com, specifically the desktop called Ping. See if you can recreate Ping more precisely, or some of the other simple desktops like blue-progression, solar-system, or tarmac.
2. Add white circles at the line intersections in your illusion image, like this:
You may run handin21 as many times as you like, and only the
most recent submission will be recorded. This is useful if you realize,
after handing in some programs, that you'd like to make a few more
changes to them.