CS21 Lab 6: OOP with Graphics
Due Saturday, October 28, before midnight
Goals
-
Create and manipulate multiple graphical objects.
-
Use method syntax to perform actions on objects
-
Write and use functions that have objects as parameters
-
Use nested loops to process gridded data.
You are strongly encouraged to review in class examples and the Graphics Documentation for reference on Graphics classes and method syntax.
1. Arrow Illusion
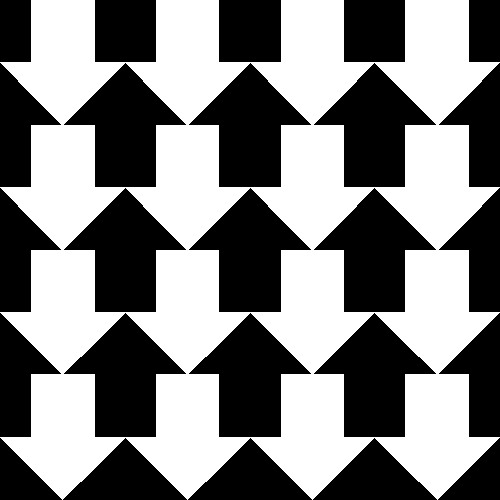
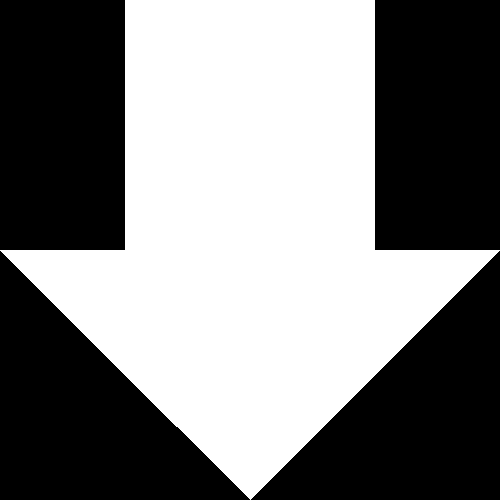
Write a program arrows.py that draws an \$n \times n\$ grid of down-pointing white arrows as shown below. When drawn correctly, the background will consist of several up-pointing black arrows of the same size. Your program should prompt the user to enter an integer number of white arrows \$n\$ in each row and then draw an \$n \times n\$ grid of arrows.
Your solution must include a helper function
draw_arrow(win, row, col)that draws a single white arrow at a particular row and column. You may choose a different color scheme than black and white, or even have a different color for each arrow, as long as there is an \$n \times n\$ grid of down-pointing arrows and equally sized up-pointing arrows in the background.
You program must wait for the user to click the mouse on the graphics window before exiting.
$ python3 arrowsA.py
Enter number of white arrows across: 4
[window displays with middle image below]
1.1. Hints
-
You should should create a square graphics window with the same width and height.
-
Use the
setCoords(xll,yll,xur,yur)method to set the coordinates of the graphics window you create regardless of the width and the height of the actual window. If you callsetCoordsafter you know the value of \$n\$, calculating the coordinates of the arrow geometry can be simplified. -
The
movemethod can help position similar objects in different locations. -
Testing with \$n=1\$ should draw a single arrow in the center of the screen
-
You can draw the arrow in two pieces using a rectangle and a triangle polygon, or one polgon that has all the points of the arrow in counterclockwise order.
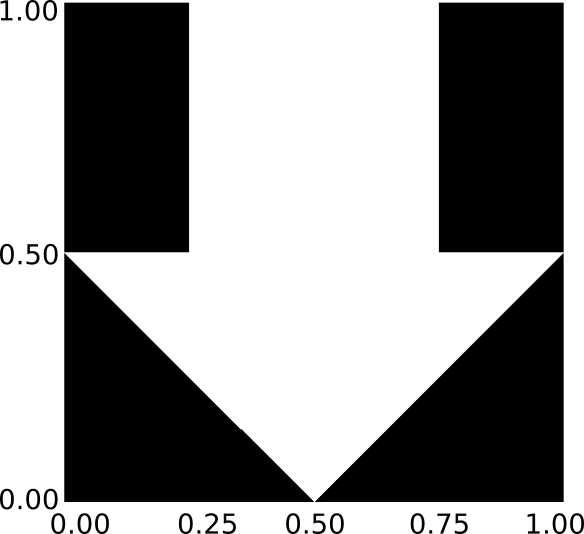
The image below shows a horizontal \$x\$ and vertical \$y\$ scale for the \$n=1\$ image, when we use setCoords(0,0,1,1) to set the scale for the graphics window. This may help you design your initial draw_arrow function. You will need to think about how to modify your code to work for larger values of \$n\$.
setCoords(0,0,1,1)1.1.1. Extras
An animated version of this illusion is also entertaining, but a bit beyond the scope of what we can do with the CS21 graphics library. Do not try to implement this.
2. Trees
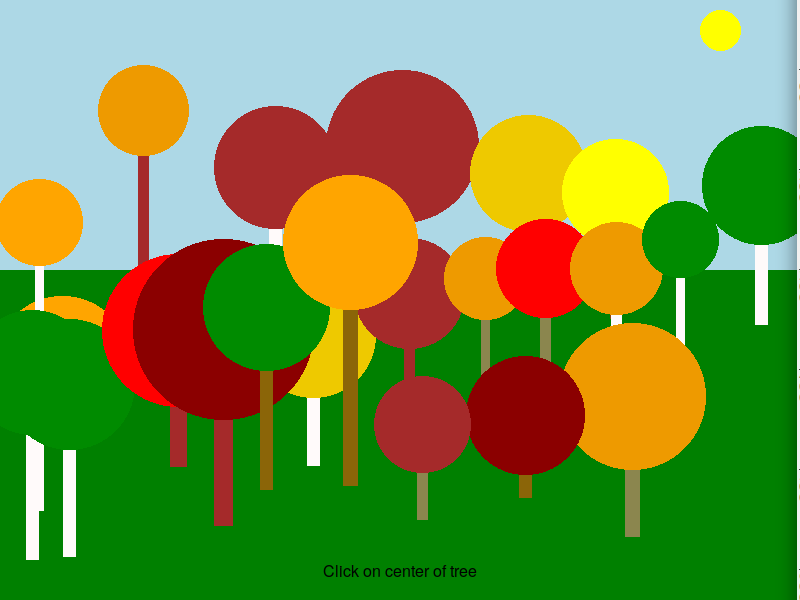
Write a program trees.py that allows a user to interactively draw a fall scene consisting of multiple trees.
2.1. Initial setup
You should start designing your program by creating a simple scene in a graphics window consisting of
-
A rectangular sky at the top
-
A rectangular ground at the bottom
-
A circular sun somewhere in the sky, preferably near the top of the window
Write a function make_sun(win) that creates the sun object in the graphics window and returns the circle object representing the sun. Additionally, write a function make_ground(win) that creates the ground and returns the rectangular object representing the ground. Write a main function that creates the primary graphics window, calls your two helper functions, and then repeatedly gets mouse clicks from the user until the user clicks inside the sun. When the user clicks inside the sun, the program should exit.
To determine if a click is inside the sun, compute the distance \$d\$ from the click to the center of the circle. If this distance is less than the radius of the sun, the point is inside the circle. To compute the distance between two points, \$p_1\$ and \$p_2\$, use the formula: \$d=\sqrt{(p_1.x-p_2.x)^2+(p_1.y-p_2.y)^2}\$. The notation \$p_1.x\$ means the \$x\$ coordinate of point \$p_1\$.
You must write a distance function to compute and return the distance between any two points.
You could also write an inside function that determines if a click point is inside a circle that uses your distance function.
2.2. Adding trees
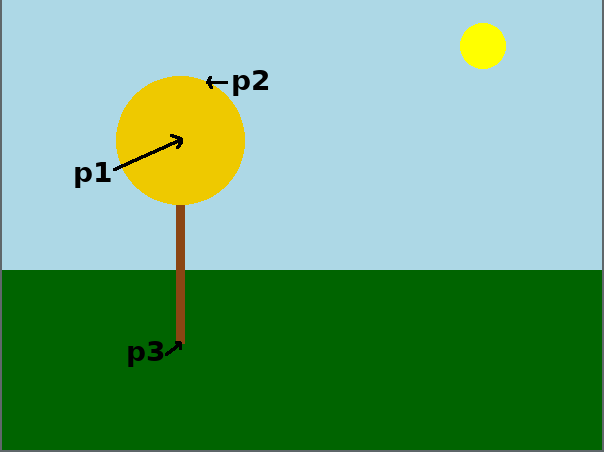
A tree is define by three points:
-
\$p_1\$: the center of the tree’s canopy.
-
\$p_2\$: a point on the edge of the tree’s canopy
-
\$p_3\$: a point located at the height of the base of the tree’s trunk.
The annotated image below shows the location of clicks for one sample tree. It wouldn’t be Swarthmore without a labeled tree somewhere.
Once the user has clicked on three points defining a single tree, you should draw a tree as follows:
-
Compute the distance \$r\$ between \$p_1\$ and \$p_2\$ using the distance formula above.
-
Create a circle with center \$p_1\$ and radius \$r\$ of a random fall color.
-
Compute the trunk size \$t=\sqrt{r}\$.
-
Compute the trunk base \$b=p_3.y\$. If \$b\$ is located in the sky and not in the ground, modify \$b\$ to be the top of the ground.
-
Create a rectangular trunk of width \$t\$ centered around \$p_1.x\$ and extending vertically from \$p_1.y\$ to \$b\$.
-
Pick a random color for the trunk.
-
Draw the trunk first, then the circle.
Modify your program to draw a tree after every three clicks. You must write a draw_tree function of your own design. If the user clicks on the sun after clicking on \$p_1\$ and \$p_2\$, your program should still quit. If the canopy of the tree covers the sun, your program should still exit if the user clicks where the sun was located previously.
Create a Text object that instructs what step is next. You can create a single Text object and use setText to change the current prompt as needed.
2.3. Example
The video below shows a sample of the program in use. For clarity, the individual mouse clicks are marked as black points until the tree is drawn. You do not need to implement this feature.
2.4. Hints
-
Proceed incrementally. After the initial setup, modify the code to draw a circle of a fixed sized at the center of every mouse click. Then refine your solution to draw circles of different size using two clicks, \$p_1\$ and \$p_2\$. Next support the three click tree. Finally add random color support.
-
The methods
getP1()andgetP2()return the opposite corners of aRectangleobject. This may be helpful for determining the height of the ground. -
It may be helpful to store point clicks temporarily in a list and then draw a tree once you have three clicks.
-
You can create an empty list with the syntax
[] -
You can use
.append()to add a point to an existing list -
You can erase all the points in a list, resetting the list to empty using the
.clear()method.
-
-
Your
draw_treefunction should not callwin.getMouse()on its own. Letmain()handle this part.draw_treeshould at least assume the user has clicked three time. -
Use
from math import sqrtto get thesqrtfunction -
Use the
choicefunction from therandomlibrary to get a random color. Here are some sample colors used:-
leaf_colors = ["brown", "red", "yellow", "orange", "red4", "gold2", "green4", "orange2"] -
trunk_colors=["brown", "snow1", "SaddleBrown", "DarkGoldenRod4", "khaki4"]
-
3. Answer the Questionnaire
Each lab has a short questionnaire at the end. Please edit
the Questions-06.txt file in your cs21/labs/06 directory
and answer the questions in that file.
Once you’re done with that, run handin21 again.
Turning in your labs….
Remember to run handin21 to turn in your lab files!
You may run handin21 as many times as you want. Each time it will
turn in any new work. We recommend running handin21 after
you complete each program or after you complete significant
work on any one program.