
circles5x5
width and height, then specify positions, sizes, lengths, etc. in relation to the width and heightinput() to ask the user for input, doing that before setting up the graphics window is often easier (less clicking back and forth between windows)update21 and put your programs in your cs21/labs/06 directoryIn this first program you'll create a grid of circles with blended coloring.
circles5x5
Here are a few steps and suggestions to help you get started. Computers need a coordinate system to draw. The Zelle coordinate system is two-dimensional, having an x-axis and y-axis. The x-axis goes from left to right. The y-axis goes from top to bottom. The point (0,0) is at the top, left corner. The bottom right corner has the coordinate (window width, window height). The coordinate (0,0) has a special name, called the origin. To draw a circle, you must give a coordinate which specifies the location of the center as well as a radius. We recommend drawing the Zelle coordinate system on paper and working out the coordinates of the shapes you wish to draw before you start programming.
Read the overview in the Zelle Graphics Documentation. This section includes a sample program which shows how to open a window and draw a circle. Copy this code into circle.py and verify that it works. This program draws a circle at coordinate (50,50) and radius 10. Verify that the size and position of the circle makes sense. Note that clicking on the window closes it.
For this question we will always have a square window of size 400. Modify circle.py so the window width and height are 400. To figure out how, look up the function definition for GraphWin(...) in the Zelle manual.
$ python3 circle.py 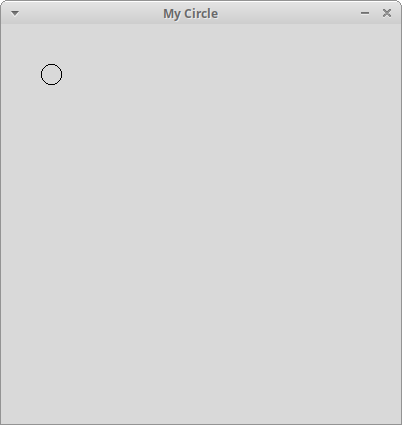
circles_tutorial
setBackground(...). Look up the function in the Zelle manual for an example to help you.$ python3 circle.py 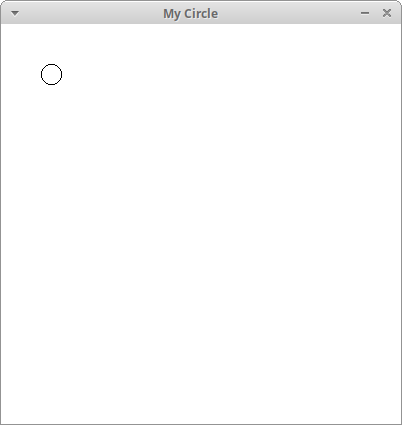
circles_background
$ python3 circle.py
Please enter a number of circles for the width and height: 5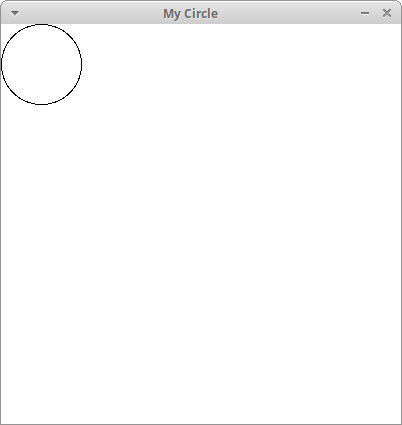
circles_single
$ python3 circle.py
Please enter a number of circles for the width and height: 5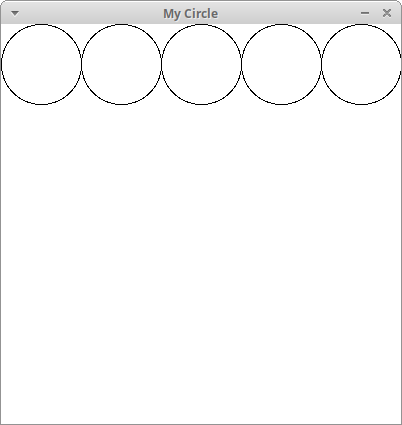
circles5x5_row1
$ python3 circle.py
Please enter a number of circles for the width and height: 5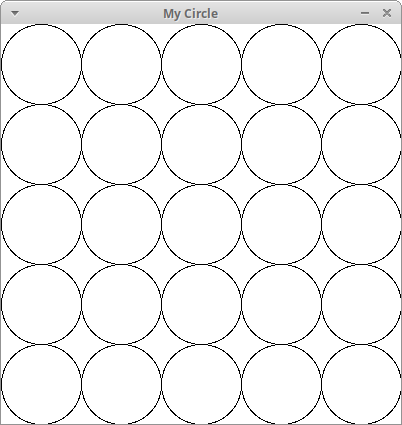
circles5x5_grid
setFill(...). Colors in Zelle are represented either with strings or with (red, blue, green) tuples of integers ranging from 0 to 255. For example, the color yellow is represented as either color_rgb(255,255,0) or as the word "yellow". The color blue is color_rgb(0,0,255) or the word "blue". See here to get tuples for different colors. In the example below, we fill the circle with the color "cyan" which is (0,255,255)$ python3 circle.py
Please enter a number of circles for the width and height: 5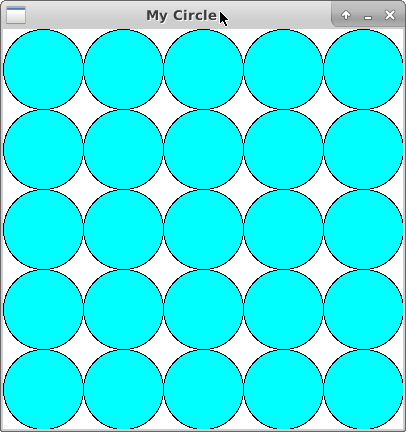
circles5x5_cyan
Last step! Define a function getColor(px,py,winSize) to generate a color for each circle based on its position using a gradient. Your function should take the circle center (px, py) and the window size as arguments and return the color. Then pass this color to the function setFill(..). Recall that a color is a tuple of (red, green, blue). We can add and scale colors to create new colors! The only constraints are that
the final rgb color values are integers
To create a horizontal gradient, we will blend between two colors based on the x-coordinate of the circle's center. When x is close to zero (the left-side of the screen), the circles will have the first color. When x is close to the window's width (the right-side of the screen), it will have the second color. When x is half the window width, the color will be 50% of the first color and 50% of the second color. Let our first color be C1 = [R1, G1, B1]T, our second color be C2 = [R2, G2, B2]T, and the percentage distance along the X-axis be α. The general formula for this gradient is
$$
\left[\begin{array}{c}
R \\
G \\
B
\end{array}
\right] =
(1 - \alpha) \left[\begin{array}{c}
R_{1} \\
G_{1} \\
B_{1}
\end{array}
\right] +
\alpha \left[\begin{array}{c}
R_{2} \\
G_{2} \\
B_{2}
\end{array}
\right] =
\left[\begin{array}{c}
(1 - \alpha) R_{1} + \alpha R_{2} \\
(1 - \alpha) G_{1} + \alpha G_{2} \\
(1 - \alpha) B_{1} + \alpha B_{2}
\end{array}
\right]
$$
Let's start by breaking down what this formula means:
Now let's look at some examples. Suppose our window size is 400. What is the color of a circle at location (0,0)? α will be 0/400 = 0, or 0% across the window. Now suppose our first color C1 is yellow [255, 255, 0]T and our second color C2 is blue [0, 0, 255]T. In this case, the gradient color is 100% of the first color and 0% of the second color, which we can see by plugging in our values
$$
\left[\begin{array}{c}
255 \\
255 \\
0
\end{array}
\right] =
(1 - 0) \left[\begin{array}{c}
255 \\
255 \\
0
\end{array}
\right] +
0 \left[\begin{array}{c}
0 \\
0 \\
255
\end{array}
\right]
$$
Now suppose we have a circle at position (400,0). Now α is 400/400 = 1, or 100% across the window. When we plug in our values, we see that we get 0% of the first color and 100% of the second color.
$$
\left[\begin{array}{c}
0 \\
0 \\
255
\end{array}
\right] =
(1 - 1) \left[\begin{array}{c}
255 \\
255 \\
0
\end{array}
\right] +
1 \left[\begin{array}{c}
0 \\
0 \\
255
\end{array}
\right]
$$
Verify for yourself that a circle at position (200,0) will be 50% of C1 and 50% of C2. You may use any colors you like. The following screenshot uses the colors yellow and blue.
$ python3 circle.py
Please enter a number of circles for the width and height: 5circles5x5
$ python3 circle.py
Please enter a number of circles for the width and height: 50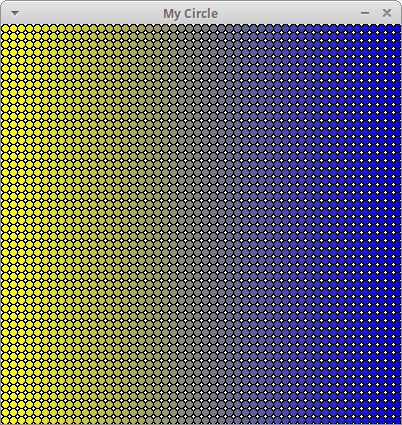
circles50x50
Write a program called aquarium.py that generates an animated aquarium, using mouse-clicks from the user. Here is an example:
Here are the requirements and some tips for this program:
Create a fixed sandy ground using a Rectangle (not based on user clicks).
Create and update a Text object that tells the user what to do in each step. The setText(<string>) method can be used to change the text at each step. The input string can also be the empty string.
Create a function that makes and draws one small fish at a given Point. The fish in the video were created using a polygon. The five points of the polygon are computed relative to the given point (px, py). Δx and Δy are distances that you can hard-code. The numbers beside each to point is a suggested order that you can give them to the Polygon(...) constructor.
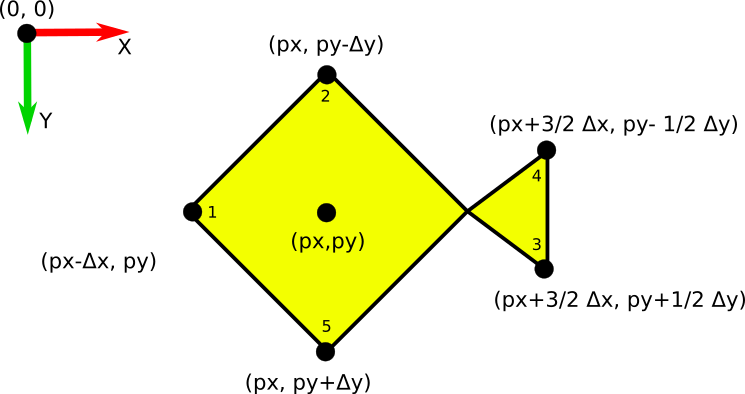
Your fish does not have to look exactly like these fish. Feel free to personalize them.
In main(), use a while loop to let the user click to create multiple fish. Whenever the user clicks, call your fish function and pass the user's click Point as an argument. When the user clicks on the ground, the while loop should end.
In main(), after creating the small fish, ask the user for a point to create a giant fish. (Note: It's possible to create your large fish in main(). However, try to think about how you can modify your fish function to create either small fish or large fish.) Write a loop to move the giant fish across the screen. To animate, call the function move(..). You can choose to iterate the animation for a fixed number of frames, or you can exit the loop on mouse click using the function checkMouse().
Finally, when the user next clicks, exit and close the window.
There are many ways to extend this animation.
Here are some sample videos with ideas
$ python3 circle.py
Please enter a number of circles for the width and height: 5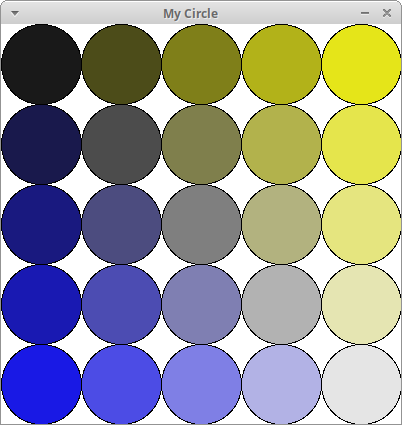
circles5x5
In circle.py, modify your getColor(..) function to do a two-way gradient. In this case, we blend in both the X and Y directions and can use up to four colors! You can think of the two-way gradient like so:
$$
\left[\begin{array}{c}
R_{x1} \\
G_{x1} \\
B_{x1}
\end{array}
\right] =
(1 - \alpha_x) \left[\begin{array}{c}
R_{1} \\
G_{1} \\
B_{1}
\end{array}
\right] +
\alpha_x \left[\begin{array}{c}
R_{2} \\
G_{2} \\
B_{2}
\end{array}
\right]
$$
$$
\left[\begin{array}{c}
R_{x2} \\
G_{x2} \\
B_{x2}
\end{array}
\right] =
(1 - \alpha_x) \left[\begin{array}{c}
R_{3} \\
G_{3} \\
B_{3}
\end{array}
\right] +
\alpha_x \left[\begin{array}{c}
R_{4} \\
G_{4} \\
B_{4}
\end{array}
\right]
$$
$$
\left[\begin{array}{c}
R \\
G \\
B
\end{array}
\right] =
(1 - \alpha_y) \left[\begin{array}{c}
R_{x1} \\
G_{x1} \\
B_{x1}
\end{array}
\right] +
\alpha_y \left[\begin{array}{c}
R_{x2} \\
G_{x2} \\
B_{x2}
\end{array}
\right]
$$
For example, to get the screenshot above, we let
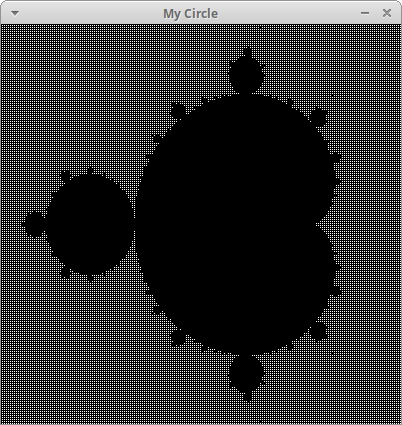
Create a new program, mandelbrot.py, that colors circles based on the Mandelbrot set. For this challenge, you should modify circle.py so that getColor(px, py, winSize) uses the Mandelbrot formula to compute a color for each circle.
To start, modify getColor(px, py, winSize) to return white if we're outside the set and black otherwise. A point (px,py) is inside the set based on an "escape condition". We start by computing offsets (x0, y0) based on the circle center (px,py). We then initialize a pair (x,y) = (0,0) and repeatedly update the values (x,y) in a loop. If $ x^2 + y^2 $ becomes greater than 4, the point escapes (!) and we assign it a white color. Otherwise, we assume it is part of the Mandelbrot set, and we assign it a black color. The full pseudocode for getColor is below
    x0 = (px/winSize)*2.25 - 1.5
    y0 = (py/winSize)*2 - 1
    x = 0.0
    y = 0.0
    iteration = 0
    max_iteration = 1000

    while x*x + y*y < 2*2 and iteration < max_iteration
        xtemp = x * x - y * y + x0
        y = 2*x * y + y0
        x = xtemp
        iteration = iteration + 1

    if iteration < max_iteration
       return white
    else:
       return black
The following image shows the result of a size 400 window with 200 circles
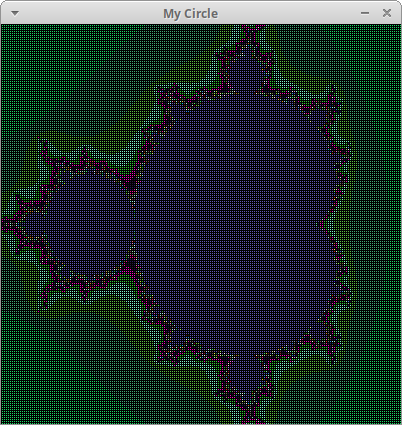
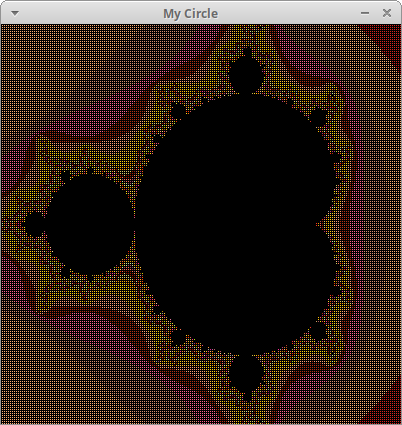
You can make a more colorful visualization of the Mandelbrot set by defining a palette. A palette is a list of colors, one for every possible iteration that a point (px,py) can escape. To define a palette, create a list in main() and add 1000 random colors to it using a loop. A random color can be generated using random.randrange(255) to generate red, green, and blue color components. Then modify getColor() to take your palette as a fourth parameter. When iteration is less than 1000, use the color from your palette. Otherwise, return black as before.
Below is an example using a size 400 window with 200 circles.
Each lab has a short questionnaire at the end. Please edit the QUESTIONS-06.txt file in your cs21/labs/06 directory and answer the questions in that file.
Don't forget to run handin21 to turn in your lab files! You may run handin21 as many times as you want. Each time it will turn in any new work. We recommend running handin21 after you complete each program or after you complete significant work on any one program.