These items are mandatory and you will be graded on them.
width and height, then specify positions, sizes, lengths, etc. in relation to the width and heightHere are some additional tips to help you out.
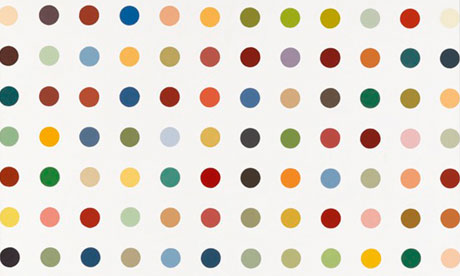
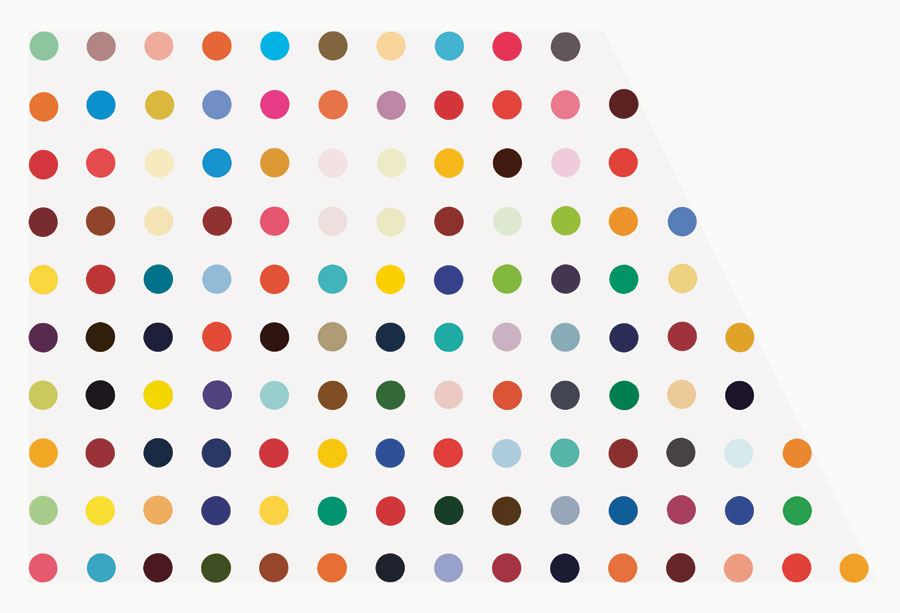
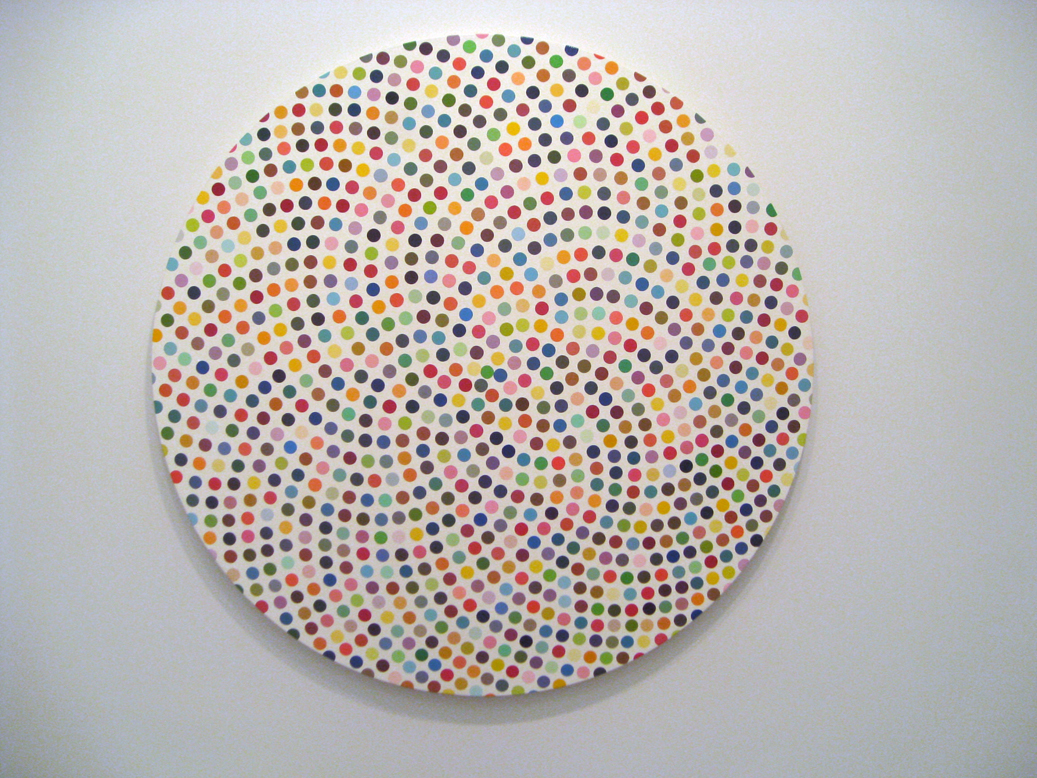
input() to ask the user for input, doing that before setting up the graphics window is often easier (less clicking back and forth between windows)In lab you will be creating dynamic versions of Spot Paintings like those of artist Damien Hirst. The idea is to inspire a different mood or reaction depending on the pattern of colors. The goal of this lab is to create a similar painting. An example of his work is shown below:
In the dots.py file, we have provided a partial implementation of the main function, a complete implementation of the point_distance function, and function stubs for the rest of the functions you will need to write to complete the lab. You will need to write implementations of the functions we have provided as stubs and complete main so that it calls the functions you have written in a way that solves the problem presented below.
Here are all the functions (or function stubs) that are in the dots.py file:
def main():
    """ the main function for this lab """

def create_row(num_cols, y_coord, radius):
    """ returns a list of circles representing a single row """

def create_grid(num_cols, num_rows, radius):
    """ returns a list storing the grid of Circles; uses create_row """

def colorize(circ):
    """ sets the fill and outline of circ (a Circle) to a random color """

def shake_grid(grid):
    """ randomly moves all the circles on the grid """

def inside_circle(circ, pt):
    """ return True if pt (a Point) is inside of circ (a Circle),
        False otherwise; uses point_distance """

def point_distance(pt1, pt2):
    """ return the distance between two Point objects, pt1 to pt2
        using the Pythagorean theorem a^2 + b^2 = c^2. """
The steps below will guide you through an incremental development of the solution.
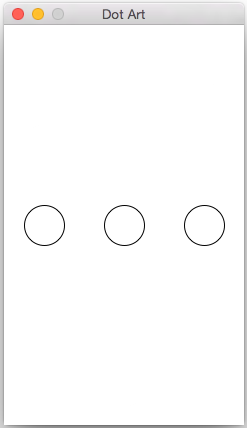
First, ask the user for the number of rows and columns, and then create a graphics window based on those numbers (see images below). The radius of your circles can be fixed (here it is 20), but make sure to store this value in a variable. Based on the radius and the number of columns (and the space between each circle, which is equal to the diameter of a circle), compute the width of the window. Similarly, based on the radius and the number of rows, compute the height of the graphics window.
Note: no dots/circles are being drawn, yet, but the size of the window should change as the user enters different values. Test your code with different values for the number of rows and columns! (Note: if the user chooses only 1 column the "Click to exit" message won't fit entirely in the graphics window but that's OK.)
$ python3 dots.py
Enter the number of rows: 5
Enter the number of columns: 10
Next, implement the create_row function. This function has three parameters: the number of columns, the y-coordinate where the center of each circle will be, and the radius of each circle. This function will not draw the circles. Instead, it will just create the circles, add them to a list, and then return the list of circles.
def create_row(num_cols, y_coord, radius):
    """ returns a list of circles representing a single row """
Hint: make a diagram on paper first and see how you might use a loop variable to keep track of the x coordinate of the centers of the circles. Here is an example to help you get started.
In main(), call create_row to test the function. For example, you could call create_row with a y_coord of height/2 to create a row of circles in the middle of the window. Then, once you have the list of circles, add a for loop in main() to draw each circle in the row.
Once you have create_row working, implement the create_grid function:
def create_grid(num_cols, num_rows, radius):
    """ returns a list storing the grid of Circles; uses create_row """
This function will use a for loop to call the create_row function for each row, changing the value of the y_coord with each call. Since create_row is helping you make the grid in this function, we say that create_row is a helper function. (We will see another function in step 5.)
Again, do not draw the circles in this function. This function just creates the circles and returns them in a list.
In create_grid, use a list accumulator to create a big list of all of the circles. Each time you get another row of circles back from create_row add them to the big list of circles.
In your main function, remove your test(s) for create_row and instead call the create_grid function to make a list containing the entire grid of circles. Then, modify the for loop for drawing one row so that your loop draws all the circles in the list.
Here are two examples of how your code should look at this point:
$ python3 dots.py
Enter the number of rows: 6
Enter the number of columns: 8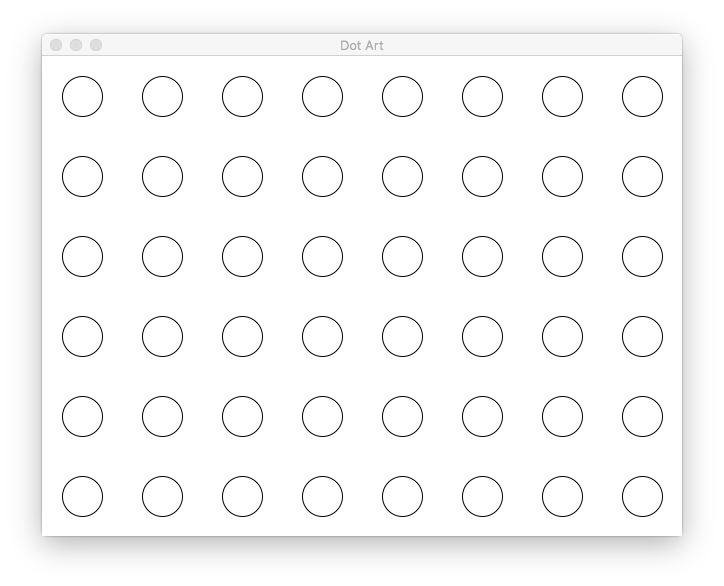
    $ python3 dots.py
    Enter the number of rows: 5
    Enter the number of columns: 3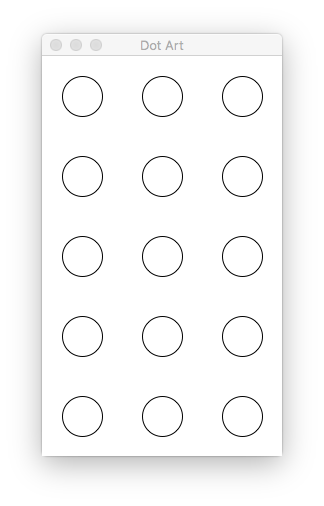
Next, implement the function the function colorize:
def colorize(circ):
    """ sets the fill and outline of circ (a Circle) to a random color """
This function takes a circle as a parameter and sets the fill and outline of the circle to a random color. Inside your function, call the graphics function color_rgb(r,g,b), which takes 3 integers as parameters: the red, green, and blue components of the color. These components can be 0-255, inclusive. Using the random library, choose values for each component. The return value of color_rgb can be used just like any other color:
>>> color = color_rgb(128, 255, 0)  # a light greenish color
>>> circle.setFill(color)
After choosing a random color, this function will change both the fill and outline color of the circle to this random color. There is no return value.
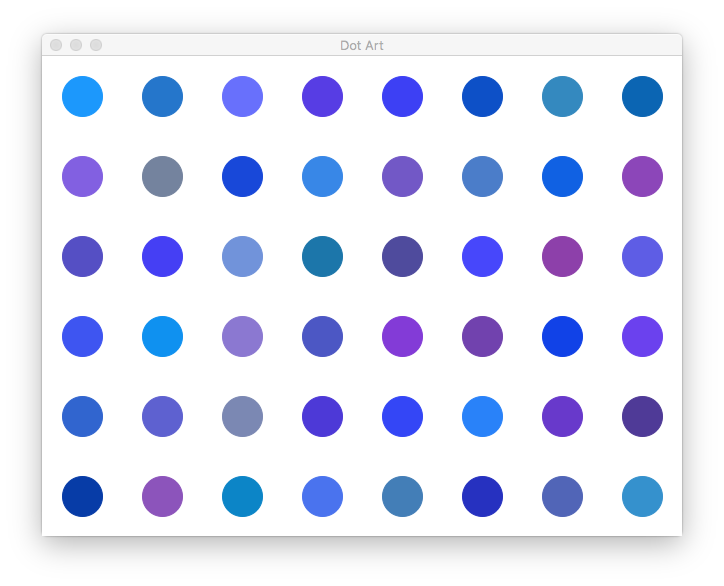
After you've completed this function, use it to change the fill and outline of every circle in your grid. Call the function inside the loop you have been using to draw the circles. Below are a few example runs. Since the colors are random, you should get something similar but of course the colors will not match.
    $ python3 dots.py
    Enter the number of rows: 6
    Enter the number of columns: 8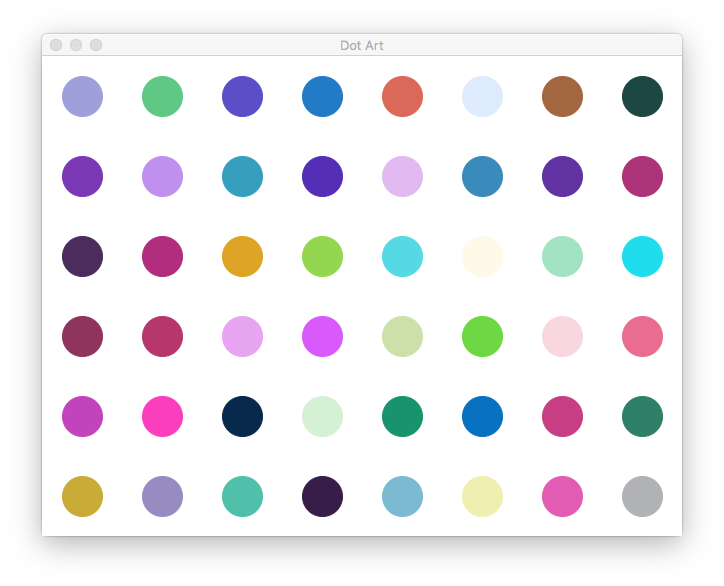
    $ python3 dots.py
    Enter the number of rows: 5
    Enter the number of columns: 3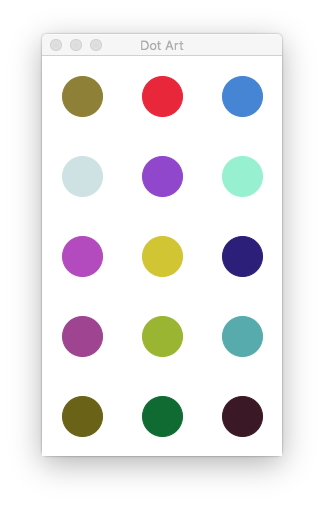
We have provided you with the code for the function point_distance(pt1, pt2) which calculates the distance between pt1 and pt2 using the Pythagorean theorem. Use that to write a function called inside_circle. The inside_circle function takes a Circle and a Point as parameters and returns True if the Point is located inside a Circle; otherwise, it returns False. Use the point_distance function as a helper function. A point is inside the circle if the distance from the center of the circle to the point is less than or equal to the radius of the circle.
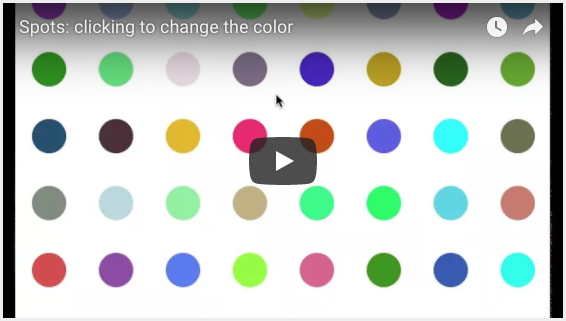
In main(), add another loop to allow the user to click 10 times. For each click, determine if that point is inside any of the circles in the grid of circles. If it is inside any of the circles, use the colorize function to give the circle a different random color. Here is a video how this will work. Note that you should not draw a black circle where the user is clicking, this is just to help you see where the user clicked.
In the last step of the lab, implement the function shake_grid:
def shake_grid(grid):
    """ randomly moves all the circles on the grid """
The shake_grid function takes a list of circles and randomly moves each circle a small amount in the x and y directions. For example, you might want to move -1, 0, or 1 pixels in the x direction and -1, 0, or 1 pixels in the y direction. The function should loop through all of the circles in the grid and move them each a different random x and y value. Since the circles are mutated, there is no return value from the function.
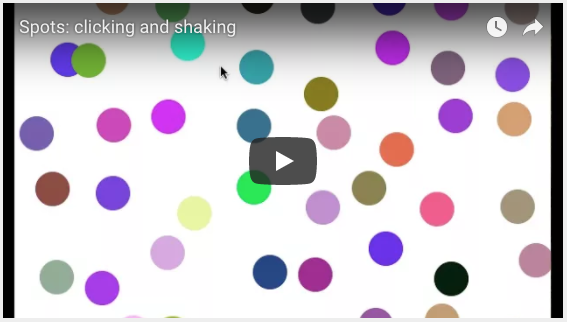
Once you have shake_grid written, call the shake_grid function repeatedly in a loop from main(). You can decide how long to delay between calls to shake_grid, as well as how many times to shake the grid, before exiting the program.
Here is a video demonstrating a possible complete solution. Again, note that you should not draw a black circle where the user is clicking, this is just to help you see where the user clicked to make the video below.
(Optional) If the user clicks outside of any circle, change the background color to a random color.
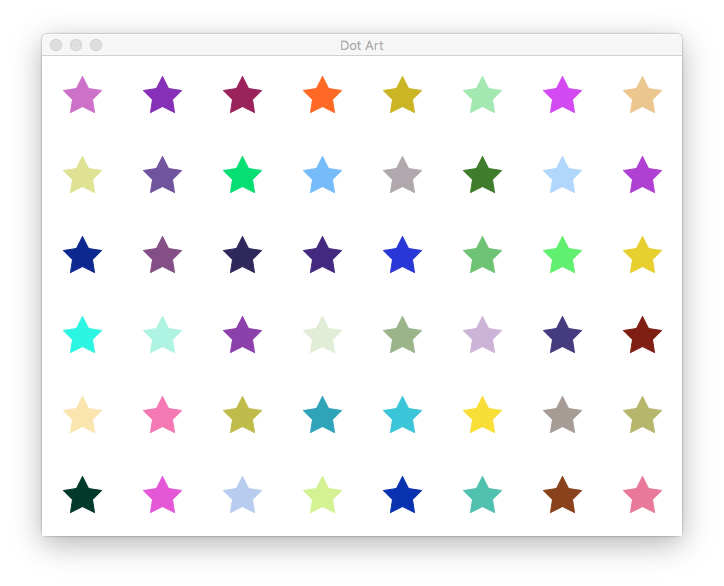
(Optional) Instead of creating circles, try creating other shapes like stars, diamonds, ovals, or any other shape you'd like. Here's a grid of stars:
(Optional) Use the checkMouse method instead of the getMouse method so that users can click on the circles while they are shaking.
(Optional) Instead of shaking a fixed number of times, use the check_key method to keep shaking until the user presses the letter "q".
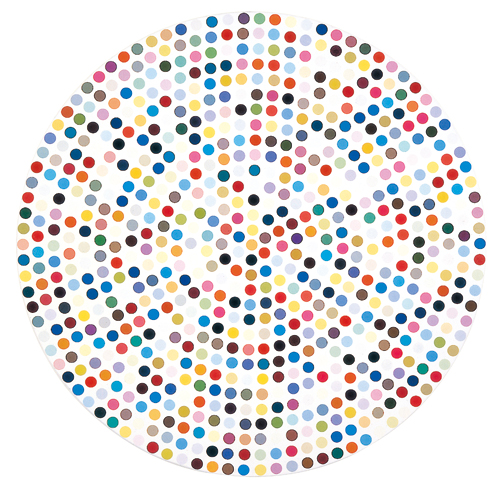
(Optional) Here are a few more examples of Damien Hirst's work - feel free to create related examples, either exactly replicated or loosely inspired.
Dots are arranged in a circle:
Dots are arranged in a spiral inside a circle:
Each lab has a short questionnaire at the end. Please edit the QUESTIONS-06.txt file in your cs21/labs/06 directory and answer the questions in that file.
Don't forget to run handin21 to turn in your lab files! You may run handin21 as many times as you want. Each time it will turn in any new work. We recommend running handin21 after you complete each program or after you complete significant work on any one program.