CS21 Lab 5: Graphics Library and Objects
Due Saturday, March 2, by 11:59pm
Goals
The goals for this lab assignment are:
-
Get practice programing with objects in Python
-
Learn to use the Graphics Library
-
Some more practice with functions
-
Some more practice with loops and nested loops
Getting and Working on Lab05 Code
Make sure you are working in the correct directory when you edit and run lab 05 files.
Run update21 to get the starting point code of the next lab assignment.
This will create a new ~/cs21/labs/05 directory for your lab work.
Edit and run Lab 05 programs from within your cs21/labs/05
directory.
Make sure all programs are saved to your cs21/labs/05
directory! Files outside that directory will not be graded.
$ update21
$ cd ~/cs21/labs/05
$ pwd
/home/username/cs21/labs/05
$ ls
(should see your program files here)
Then edit and run program files in your ~/cs21/labs/05 directory:
$ code filename.py
$ python3 filename.py
1. Draw a Face
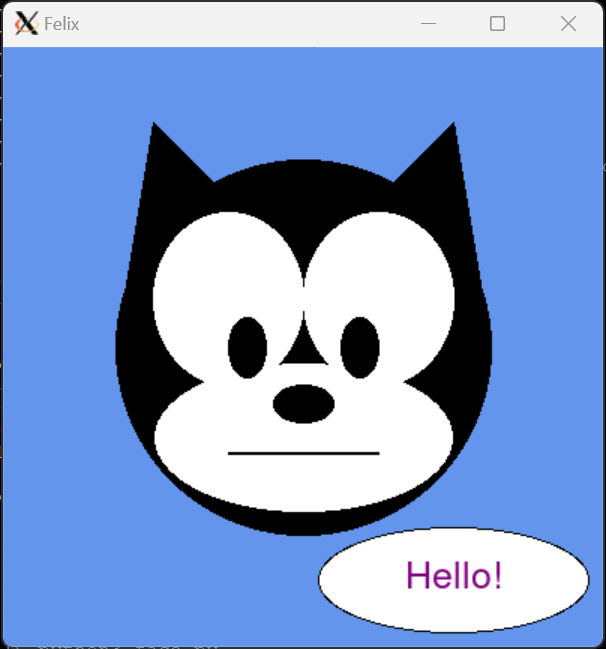
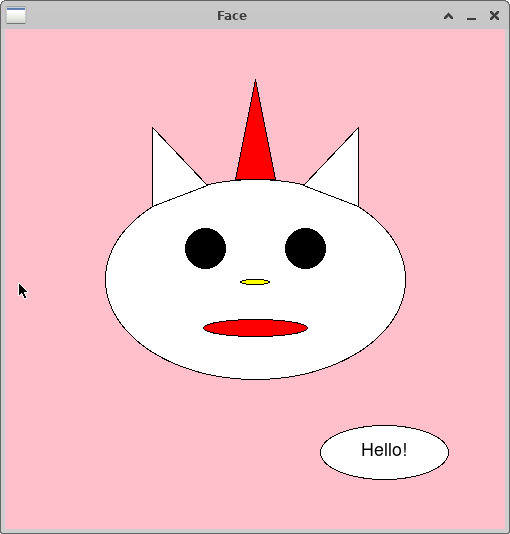
In face.py you will write a program that draws a face. Your face can
be that of a human, an animal, a cartoon, a fantasy creature, a …
This is an opportunity to have some fun with the graphics library.
1.1. Required Features
Your program should have the following features:
-
Draw a face with at least 5 different features in addition to the main head shape. Some features include: eyes, nose, mouth, ears, hair, beard, antenna, horns, teeth, …
-
Your face should use at least 3 different shapes, and 3 different colors (background color counts).
-
The first mouse click should have your character say something (in text). Please keep the message friendly.
-
The second mouse click should exit your program (i.e. make sure that your program does not exit before the user clicks the mouse).
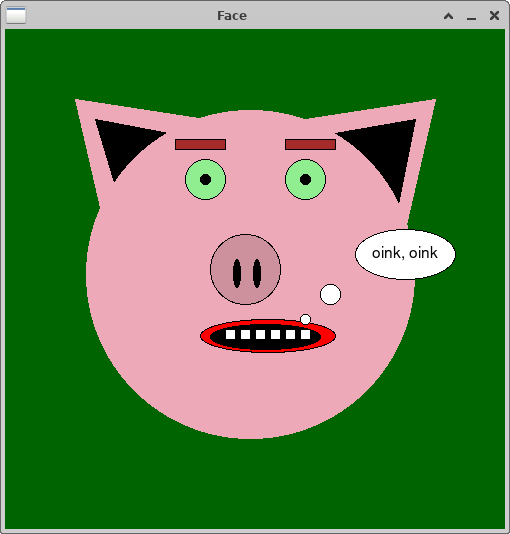
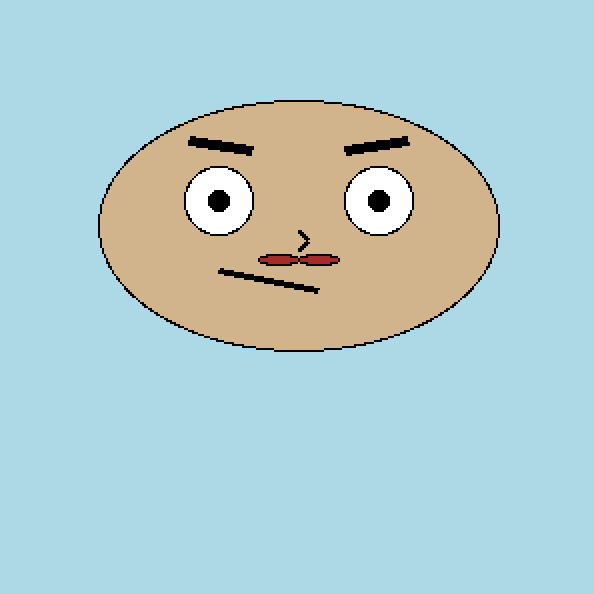
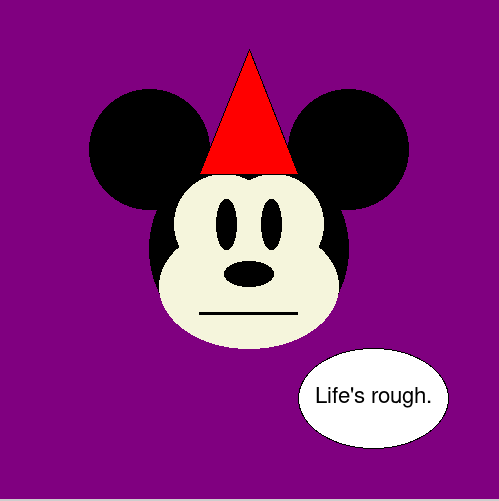
1.2. Example Output
Here are some example faces drawn by some past CS21 students, CS21 ninjas, and CS21 staff:
$ python3 face.py


1.3. Hints/Tips
-
You need to run graphics library programs from CS machines (not remotely connected).
-
Refer to the in-class programs for examples of how to use the graphics library and some different methods of some of the classes.
-
Make use of the Zelle Graphics Reference, and other references off the course Schedule, to find methods that might be useful for setting the color and position of different objects.
-
If you are reproducing two or more identical features, for example you have two eyes that are drawn from the same shapes of the same sizes, remember you can use the
clonemethod to make a copy of a shape object and themovemethod to move a shape to a new location. -
The
getMousemethod of aWindowobject waits for a mouse click. -
Remember that the order in which you draw objects that overlap changes the final outcome of what is ultimately drawn.
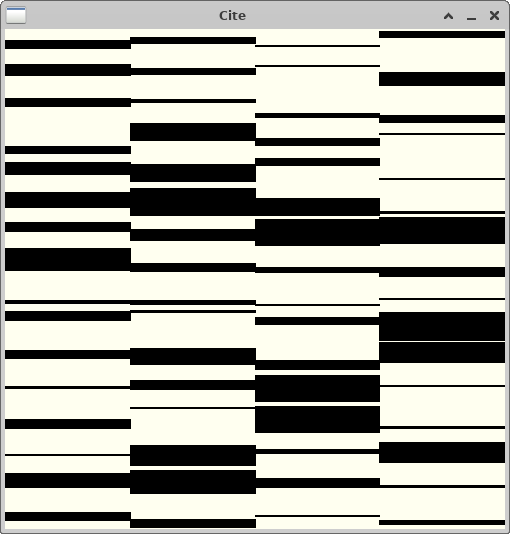
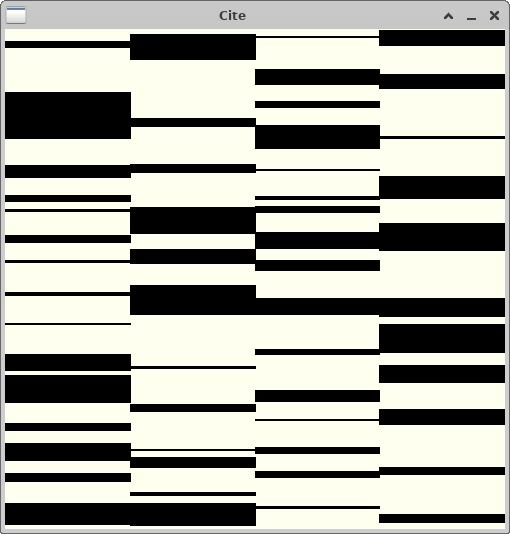
2. Approximate a Famous Painting
2.1. Overview
In two parts, you will implement a program that approximates a famous painting, Cité, by Ellsworth Kelly in 1951. When you look at this painting, note that it is divided into 20 ivory colored rectangles, each containing some number of black, non-overlapping, quadrilaterals that span the width of each rectangle.
You will write a program in two parts that creates a randomly generated pattern that is similar (with some simplifications) to Kelly’s Cité painting.
-
In Part1, you will write a function to draw a single square Cité block to the graphics window. A Cité block is an approximation of one rectangle in this painting: a single square (instead of rectangle) that contains 4 randomly sized black rectangles.
-
In Part2, you will divide the graphics window into a grid (into a square grid of \(n \times n\) cells, for a value of
nentered by the user). For each cell in the grid your program will make a call to the function you wrote in Part1 to draw one Cité block. The result will be an approximation of the Ellsworth Kelly Cité painting.
Part 1 involves most of the coding effort. Part 2 will use your Part 1 function, calling it multiple times to create each Cité block in the \(n \times n\) grid.
2.2. Part 1
In the file named citeblock.py you are going to implement the first
part of implementing a randomly generated version of a painting
that is based on Ellsworth Kelly’s 1951 painting
Cité.
For Part 1, you will implement a function that draws to the graphics window one Cité block containing 4 randomly placed, and sized, non-overlapping black rectangles. You will treat the entire square graphics window as a single unit square cell into which your function will draw a single Cité block.
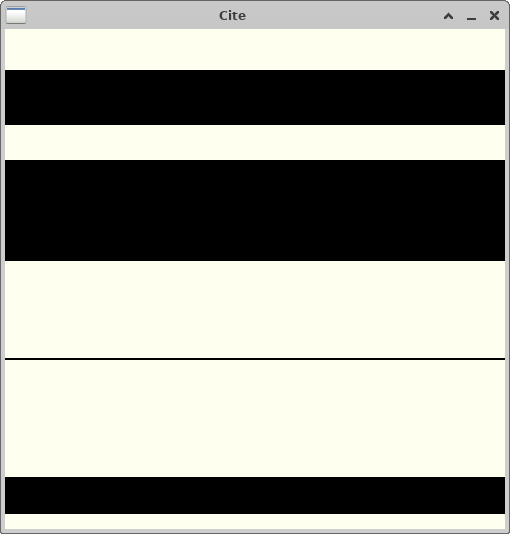
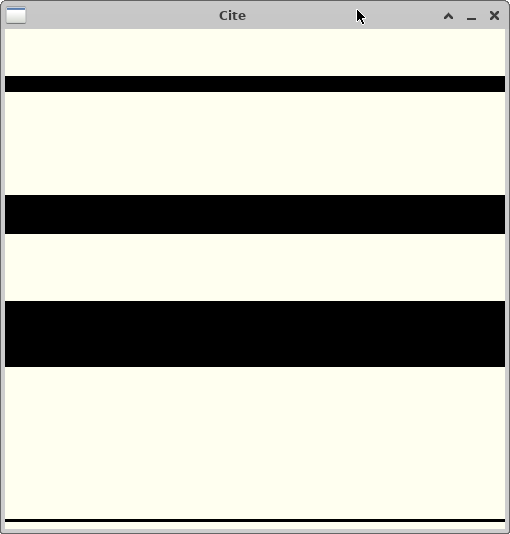
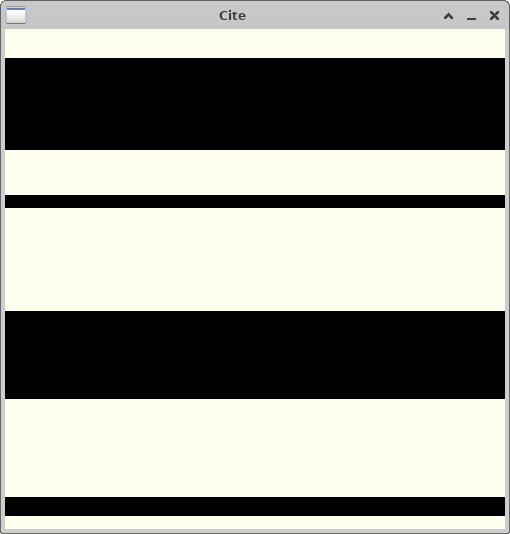
2.3. Example Output
To run:
$ python3 citeblock.py
Here is example output from three runs of a working program (note that each run produces different black rectangles):
2.4. Required Features
Your program should have the following features:
-
Create a square graphics window.
-
Use the
setCoords(xll,yll,xur,yur)of theWindowobject to reset the coordinates of the graphics window to be(0,0,1,1). Everything you draw inside the window will have coordinate values in this range vs. the default window x and y coordinate values. This figure shows how the coordinates are are mapped onto the graphics window in this case.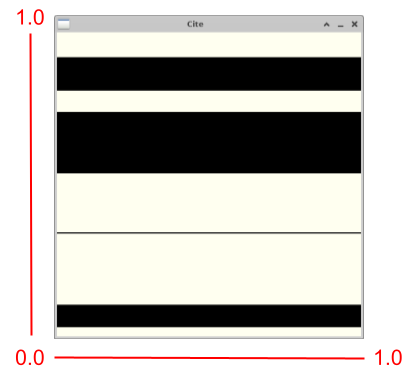 Figure 8. view of the graphics window after calling setCoords(0,0,1,1). This treats the entire graphics window as a single cell into which a single Cité block is drawn.
 -
Implement a function called
draw_cite_blockthat has the following prototype:def draw_cite_block(window, row, col): """ Draw a Cité block in position row, col in the window window - The Graphics window object in which to draw the block row - The row in the window into which the block is drawn (int) col - The column in the window into which the block is drawn (int) returns - no return value """This function draws 4 randomly sized and positioned black rectangles into a unit cell at position
(row,col)in the grid of cells.For Part 1, you will make one call to this function to draw a single Cité block into cell
(0,0)that fills the graphics window. For Part 2, you will need to use therowandcolparameters to draw a Cité block into multiple unit cells in an \(n \times n\) grid of unit cells.The black rectangles in each cell should fill the cell horizontally. Their heights will be determined from randomly selected y-axis coordinates for the bottom and top of the rectangle.
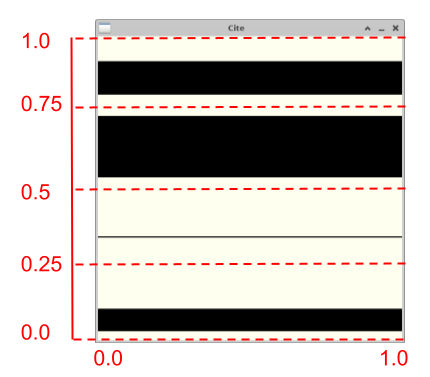
Your algorithm should logically divide the cell into 4 horizontal slabs stacked vertically on top of each other. In each of the 4 partitions, randomly select two y-axis points for the lower left and upper right of the rectangle to draw into the unit cell. Here is how you should partition the unit cell into which
draw_cite_blockwill draw 4 random rectangles:
-
The exact algorithm you use for determining the position for the two randomly selected y-axis points for each rectangle is up to you given the following constraints:
-
each rectangle should be drawn within its 0.25 division of the full cell; a rectangle cannot be larger than 0.25 of the total height, and the 4 rectangles may not overlap.
-
you must randomly select the the y-coordinate values for each rectangle given the above constraints.
-
-
you must randomly select the the y-coordinate values for each rectangle given the above constraints.
-
You must use a loop to draw each of the 4 rectangles (we recommend a
forloop). Think about how to vary the position of the y-coordinate values of each of the four rectangles based on the loop counter variablei(think ofias being associated with one of the four vertical divisions of the Cité block, into which you draw a rectangle).If at first you have trouble with the loop solution, you can first draw each random rectangle with 4 separate code sequences (that are very similar), and then think about the general pattern based on i and change your code to use a loop to draw a rectangle into the correct division of the Cité block.
-
2.5. Hints/Tips
-
ivoryis one color you can use for the background to get a off white tone. Feel free to find and use another color that will make an off-white background. -
random()function returns a value between0.0and1.0. You can use the value returned from this function combined with an arithmetic expression to determine the y-coordinate values of the 4 black Rectangles of random sizes that you draw into the cell.If you want a random float value between a different range (e.g., between
0.0 and 0.25) you can multiply or divide the value returned by the call torandom()(e.g., divide the value returned byrandomby 4 (or multiply it by0.25)). Alternatively, theuniform(s,t)function, imported from random, returns a random float value betweensandt. -
As a first step, try drawing just a single black rectangle of randomly selected y-coordinate values into the unit cell (into the full graphics window). Once you get that to work, then modify your solution to draw 4 rectangles, each into their own partition of the cell.
-
Add some debug print statements to print out the
(xll,yll)and(xur,yur)coordinates of each of the 4 rectangles to see if you are generating the values correctly. You could also print out therowandcolparameter value each time the function is called to see if your coordinates are correctly placed within the grid cell specified byrowandcol.For example, in Part 1, all Rectangles will have a
xllvalue of0, axurvalue of1.yllandyurare the randomly selected values within each of the 4 quadrants of the cell (all with values between0and1). Note: remove or comment out debug code from your solution before you submit it. -
Instead of filling each rectangle, first just draw it to help you see where it is being drawn. This may help if you have overlapping rectangles in the cell.
-
Add some debug calls to
sleep()to slow down your program between drawing each cell to see where it is being drawn to the graphics window. For example,sleep(0.5)will pause your program for half a second:r.draw(win) # draw object r to graphics window sleep(0.5) # pause/sleep for 0.5 secondsNote: make sure to remove or comment out the call to sleep after debugging.
The
sleepfunction is in thetimelibrary, so add to the top of your program (outside ofmain), add the following to import thetimefunction into your program:from time import sleep
2.6. Part 2
|
run handin21 before starting Part2
Before starting Part 2, first run |
Begin by copying your citeblock.py solution to your cite.py file:
$ cp citeblock.py cite.py
Overwrite cite.py?  [Y,N]: Y
|
be careful copying
Be careful that you are using cp citeblock.py cite.py If you swapped the order and accidentally overwrote |
If you open cite.py in the code editor you should see your citeblock.py
code. Change the top-level comment to describe what this program does.
You will modify your program in these ways to implement your Part 2 solution that will create a full Cité-inspired painting of a user specified dimension:
-
Read in a value from the user for
n, the row (and col) dimension of the square grid of Cité blocks your program will draw. -
Call
setCoords(0,0,n,n)to reset the coordinates of the graphics window to benbyn. This divides the graphics window into \(n \times n\) unit squares, into each of which your program will draw a Cité block. -
Add code in your
mainfunction to call yourdraw_cite_blockfunction, for each square in your \(n \times n\) grid (passing the row (y-coordinate), and column (x-coordinate) of each cell).
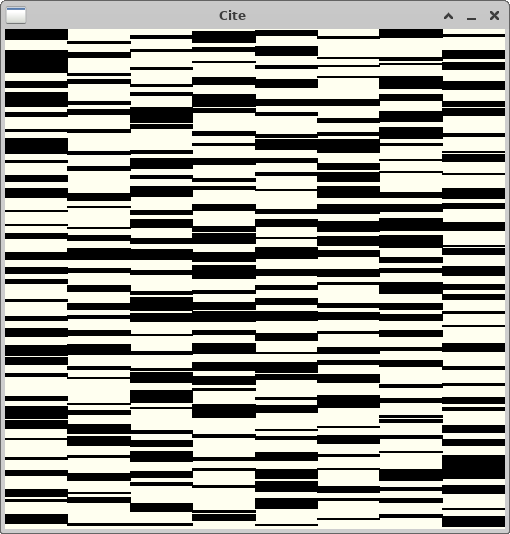
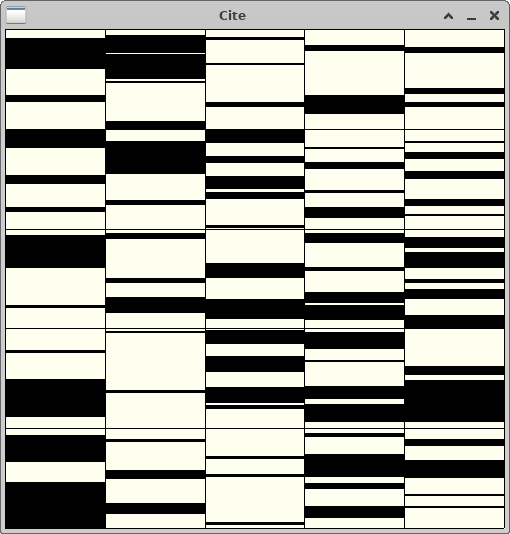
2.7. Example Output
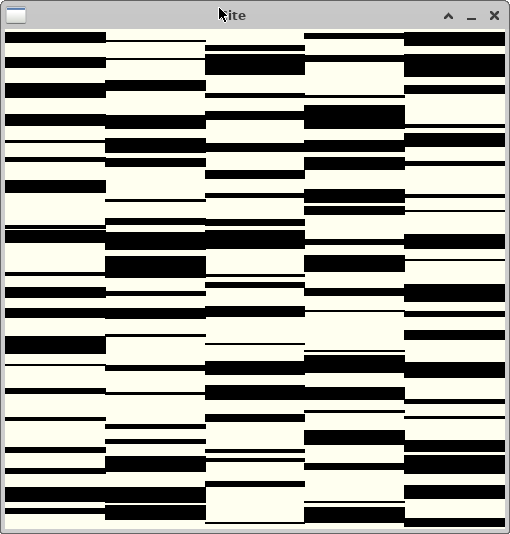
Below are some output from a few runs of a working program. In these note:
-
that each run produces different black rectangles (your
draw_cite_blockfunction should be randomly generating the 4 black rectangles inside each square). -
how the input value is used to determine the number of squares in the resulting picture.
$ python3 cite.py
How many rows do you want? 5
Here is output from two runs for rows 5:
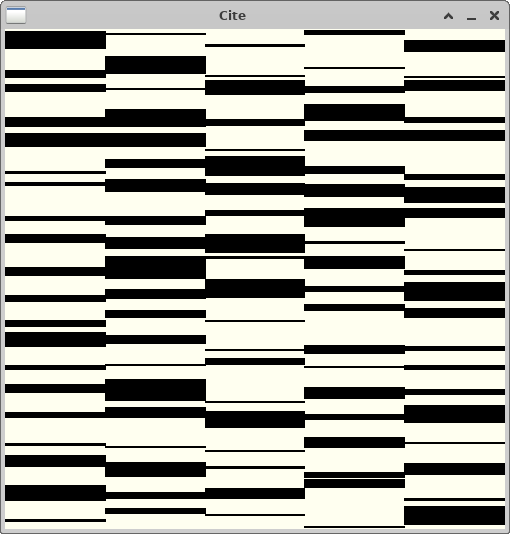
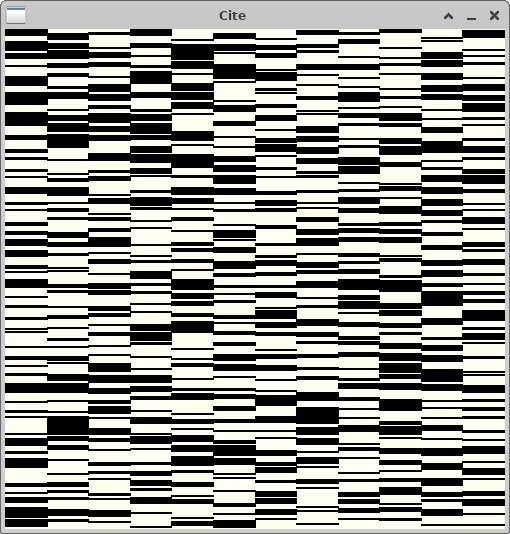
Here is output from three with different numbers of rows:
2.8. Required Features
Your program should have the following features:
-
Read in a value for
n, the number of rows (and cols) in the square grid you will create in the graphics window. -
Call
setCoords(0,0,n,n)to set the coordinates of the graphics window to be an \(n \times n\) grid of unit cells. -
Use a nested loop to make calls to your
draw_cite_blockfunction to draw a Cité block into each of the \(n \times n\) cells in the grid. -
Modify your
draw_cite_blockfunction to use thexandyparameters to draw the rectangle into the correct position in the grid. For example, whendraw_cite_blockis passed2forrowand4forcol, it will draw four randomly positioned rectangles into the unit cell(4,2)in the graphics window. This means that thexllcoordinate of all rectangles will be4(col), and thexurcoordinate of all rectangles will be5(col+1). Theyllandyurheight coordinates or each rectangle will be between2(row) and3(row+1).The
draw_cite_blockfunction will treat each cell as a unit square, but the exact coordinates of where the rectangles are drawn depend on which unit square in the the \(n \times n\) grid (i.e. they depend on the value of the parametersrowandcol). -
Your program doesn’t need to handle the case if the user enters a non-positive integer value for the number of rows.
2.9. Hints/Tips
-
First test and debug for a small number of rows (for
2first, then try3). It is easier to see what your program is doing and to decipher any debug output you add for smaller grids. Also, getting it to work for2might be large enough to have your solution work for any positive valuen. -
Add some debug print statements to print out the
(xll,yll)and(xur,yur)coordinates of the end points of each of the four rectangles to see if you are generating the values correctly.Note: remove or comment out debug code from your solution before you submit it.
-
Instead of filling each rectangle, first just draw it to help you see where it is being drawn. This may help if you have overlapping rectangles in the cell.
-
Add some debug calls to
sleep()to slow down your program between drawing each rectangle to see where it is being drawn to the graphics window. For example,sleep(0.5)will pause your program for half a second.
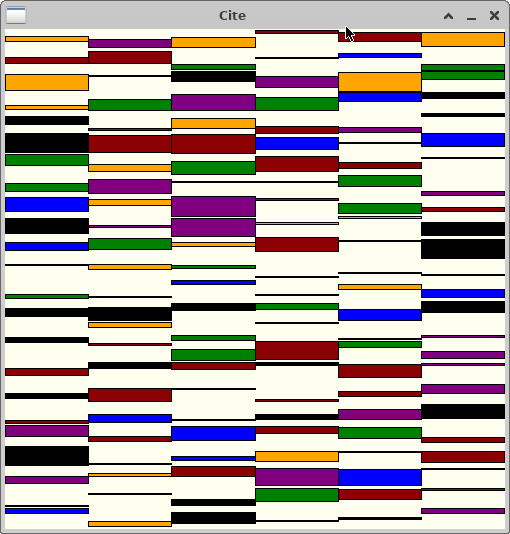
3. Extra Fun
Do not attempt this until after you have fully completed the required parts
of this assignment, and run handin21 to submit them.
This is not worth extra credit points, but is an extra features you can
add to your cite.py solution if you’d like.
First, copy your cite.py to a file named extra.py:
$ cp cite.py extra.py
Open extra.py in the code editor and added one or more of these
extensions, or any other you can think of.
-
Random Colors: Change your
draw_cite_blockfunction to take another parameter,in_colorthat ifTruewill select a random color for each randomly positioned rectangle it draws. IfFalseit will color the rectangle black. Get input from the user to indicate if they want to produce a color or a black and white version of the painting. Note that you cannot read in Boolean values, so either read in a string or an integer value (e.g., 0 for black, and non-zero for color) entered by the user and use its value to determine if you call your function with True or False$ python3 extra.py How many rows do you want? 6 Enter 0 for black and white, 1 for color : 1
-
Random number of Rectangles per Block: change your
draw_cite_blockfunction to draw a random number of rectangles per block instead of always 4. You could have it select from some set of values like 3-6 inclusive to limit the range of possibilities. -
Outline each Cité Block in a black box: change your
draw_cite_blockto create a black box around the outer edges (note that this will make any randomly placed rectangle that is only 1 pixel from the top or bottom of the cell look as if it is drawn to the edge(neighboring Cité box rectangles could merge together)). -
Rectangles: change your program, and
draw_cite_blockfunction to use rectangles vs. squares. You may need to change the parameters passed todraw_cite_blockso it knows the dimension of the rectangular space to draw rectangles into. You will need to prompt the user to enter both the number of rows (y dimension) and the number of columns (x dimension). -
Quadrilaterals: change your
draw_cite_blockfunction to randomly generate some number (default 4) of black (or color) quadrilaterals in each block instead of randomly generating rectangles. The constraint that they do not overlap should still be maintained. The result will produce blocks that look more like Ellsworth Kelly’s painting.
One of your professors implemented the first 3 features, and here are some examples runs of their solution:
Programming Tips
As you write programs, use good programming practices:
-
Use a comment at the top of the file to describe the purpose of the program (see example).
-
All programs should have a
main()function (see example). -
Use variable names that describe the contents of the variables.
-
Write your programs incrementally and test them as you go. This is really crucial to success: don’t write lots of code and then test it all at once! Write a little code, make sure it works, then add some more and test it again.
-
Don’t assume that if your program passes the sample tests we provide that it is completely correct. Come up with your own test cases and verify that the program is producing the right output on them.
-
Avoid writing any lines of code that exceed 80 columns.
-
Always work in a terminal window that is 80 characters wide (resize it to be this wide)
-
In
vscode, at the bottom right in the window, there is an indication of both the line and the column of the cursor.
-
Function Comments
All functions should have a top-level comment! Please see our function example page if you are confused about writing function comments.
Answer the Questionnaire
After each lab, please complete the short Google Forms questionnaire. Please select the right lab number (Lab 05) from the dropdown menu on the first question.
Once you’re done with that, you should run handin21 again.
Submitting lab assignments
Remember to run handin21 to turn in your lab files! You may run handin21
as many times as you want. Each time it will turn in any new work. We
recommend running handin21 after you complete each program or after you
complete significant work on any one program.
Logging out
When you’re done working in the lab, you should log out of the computer you’re using.
First quit any applications you are running, including your vscode editor, the browser and the
terminal. Then click on the logout icon ( or
or
 ) and choose "log out".
If you plan to leave the lab for just a few minutes, you do not need to log
out. It is, however, a good idea to lock your machine while you are gone. You
can lock your screen by clicking on the lock  icon.
PLEASE do not leave a session locked for a long period of time. Power may go
out, someone might reboot the machine, etc. You don’t want to lose any work!
icon.
PLEASE do not leave a session locked for a long period of time. Power may go
out, someone might reboot the machine, etc. You don’t want to lose any work!