CS21 Lab 6: Graphics, Using Objects
Due Saturday, October 28, before midnight
Goals
The goals for this lab assignment are:
-
Practice using object-oriented programming
-
Become more comfortable using dot notation to call methods of objects
-
Learn how to draw graphics in python
Programming Tips
As you write programs, use good programming practices:
-
Use a comment at the top of the file to describe the purpose of the program (see example).
-
All programs should have a
main()function (see example). -
Use variable names that describe the contents of the variables.
-
Write your programs incrementally and test them as you go. This is really crucial to success: don’t write lots of code and then test it all at once! Write a little code, make sure it works, then add some more and test it again.
-
Don’t assume that if your program passes the sample tests we provide that it is completely correct. Come up with your own test cases and verify that the program is producing the right output on them.
-
Avoid writing any lines of code that exceed 80 columns.
-
Always work in a terminal window that is 80 characters wide (resize it to be this wide)
-
In
vscode, at the bottom right in the window, there is an indication of both the line and the column of the cursor.
-
Function Comments
All functions should have a top-level comment! Please see our function example page if you are confused about writing function comments.
Spot Paintings
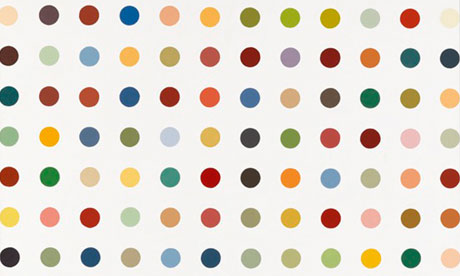
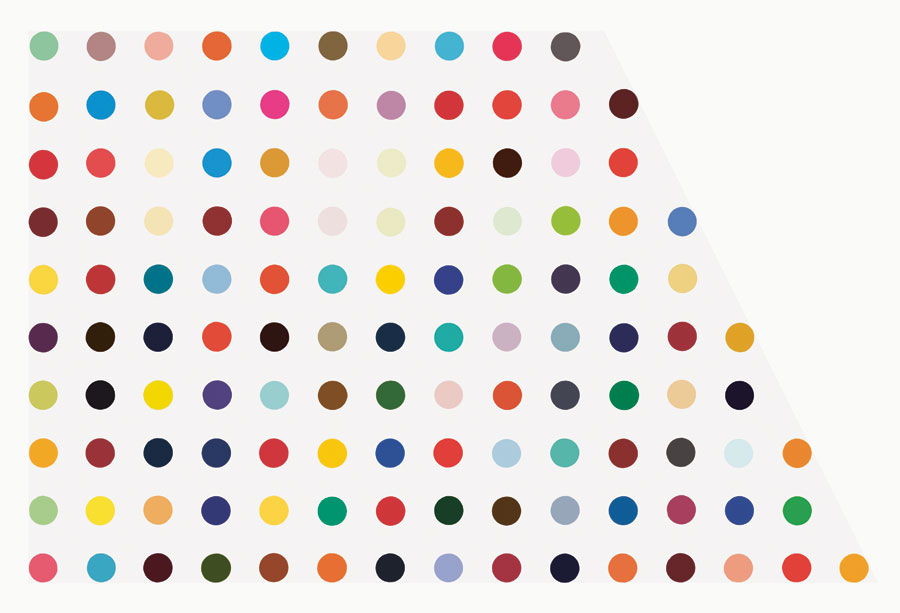
In lab you will be creating dynamic versions of Spot Paintings like those of artist Damien Hirst (Damien’s Instagram feed). The idea is to inspire a different mood or reaction depending on the pattern of colors. The goal of this lab is to create a similar painting to Damien’s Spot Paintings.
In the dots.py file, we have provided a partial implementation of the main function, a complete implementation of the point_distance function, and function stubs for the rest of the functions you will need to write to complete the lab.
You will need to write implementations of the functions we have provided as stubs and complete main so that it calls the functions you have written in a way that solves the problem presented below.
Here are all the functions (or function stubs) that are in the dots.py file,
along with a brief description:
def main():
    """ the main function for this lab """

def get_positive_integer(prompt):
    """ gets a positive integer from the user """

def create_row(num_cols, y_coord, radius):
    """ returns a list storing a row of Circles """

def create_grid(num_cols, num_rows, radius):
    """ returns a list storing the grid of Circles; uses create_row """

def colorize(circ):
    """ sets the fill and outline of circ (a Circle) to a random color """

def shake_grid(grid):
    """ randomly moves all the circles on the grid """

def inside_circle(circ, pt):
    """ return True if pt (a Point) is inside of circ (a Circle),
        False otherwise; uses point_distance """

def point_distance(pt1, pt2):
    """ return the distance between two Point objects, pt1 to pt2
        using the Pythagorean theorem a^2 + b^2 = c^2. """
The steps below will guide you through an incremental development of the solution.
1. Setting up the graphics window
1.1. The get_positive_integer function
You will start by asking the user to enter the number of rows and columns,
and the radius of each dot in main:
$ python3 dots.py
Enter the number of rows: 4
Enter the number of columns: 6
Enter the radius of each dot: 20
You’ll want to make sure that user only enters positive integers for each of these values, repeating the question if they don’t answer correctly:
$ python3 dots.py
Enter the number of rows: hello
Please enter a positive integer.
Enter the number of rows: -3
Please enter a positive integer.
Enter the number of rows: 0
Please enter a positive integer.
Enter the number of rows: 5
Enter the number of columns: 2
Enter the radius of each dot: 2.3
Please enter a positive integer.
Enter the radius of each dot: 5
To do this, you will implement the function get_positive_integer, which
you will use to read each of the values above (rows, columns,
radius). Note that Lab 5 asked you to solve a similar problem: the
get_choice function.
You are welcome to re-use parts of your implementation from Lab 5 here.
You can use isdigit() or the is_a_number function
from Lab 5 to solve this.
def get_positive_integer(prompt):
    """
    This function prompts the user to enter a positive integer.
    If the user enters anything that isn't a positive integer
    (something that isn't all digits or the number 0 which is not positive),
    ask the user to enter the value again. Repeatedly ask the user until
    they enter a positive integer.

    Args:
        prompt (str): The prompt to show the user

    Returns:
        int: The integer typed by the user
    """
    # TODO: Implement this function

    # TODO: Change this line so it returns the int entered by the user
    return 1
1.1.1. Testing the get_positive_integer function
In main, be sure that you can use the get_positive_integer function
to read in the rows, columns and radius before proceeding.
1.2. Determining the size of the graphics window
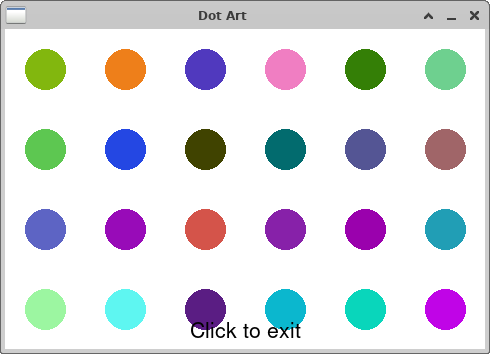
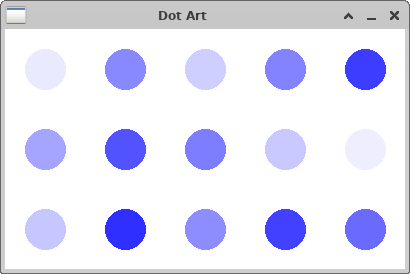
Eventually, you will use these to create a grid of randomly colored "dots"
(filled Circle objects with the user-specified radius) that has the correct
number of rows and columns, such as the one shown below:
However, before you can draw any dots, you’ll need to make sure that the
GraphWin graphics window is the correct size to hold the dots you plan on
drawing.
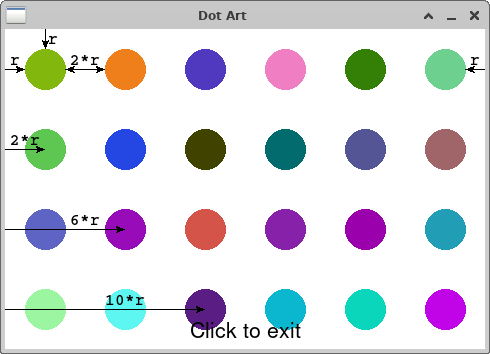
In this example, since the user said they wanted 6 columns, the width of the graphics window needs to be wide enough to hold 6 dots. The user also specified that they wanted each dot to have a radius of 20. So your window needs to be wide enough to hold 6 dots, each with radius 20. In addition, you want to leave space in between each dot (equal to 2 times the radius) and you want to leave space on the edge (equal to the radius). Therefore, in this example, your window would be 480 pixels wide. You should check your understanding by being sure you can calculate the same value.
Similarly, the height of the window needs to be set based on the number of rows. The same spacing between dots and at the edges applies as above. Try calculating the height of the window yourself and be sure you understand why the height would be 320 pixels for this example.
Below is an annotated version of the grid shown above. You may find this
helpful as you think about how large the window should be given different
values for the rows, columns and radius. In the diagram below, r is the
size of the radius. Notice how there is a boundary of r (one radius) along
the edges and a boundary of 2*r (two times the radius) in between each dot:
Using the values entered by the user for rows, columns, and radius, compute
the size of the graphics window in main. You should not be drawing any dots yet.
Try different values for the number of rows and columns, and different radius
values. The size of the window should change as the user enters different values.
(Note: if the user chooses only 1 column, or a small radius, the
"Click to exit" message won’t fit entirely in the graphics window but that’s OK.)
2. The create_row function
Now that the graphics window is set up, you will create a single row of dots
using the create_row function. This function will create a list of Circles
representing a single row of dots, but this function does not draw anything.
The stub for create_row is as follows:
def create_row(num_cols, y_coord, radius):
    """
    Creates a row of circles num_cols wide, each circle having the
    given radius. Each circle is spaced 2*radius apart. Each circle
    will have a different x-coordinate as its center, but all circles
    will have the same y-coordinate, y_coord, as their center.
    Args:
        num_cols (int): number of circles in one row
        y_coord (int): the center of each circle on the y-axis
        radius (int): the radius of the circle
    Returns:
        list: a list of Circle objects
    """
    # TODO: Implement this function

    # TODO: Change this line so it returns a list of Circles
    return []
This function has three parameters: num_cols (the number of columns),
y_coord (the y-coordinate where the center of each circle will be),
and radius (the radius of each circle). This function will not draw the
circles. Instead, it will just create the circles and add them to a list.
After the list is created, this function will return the list of circles.
In the example above, the user indicated that they wanted 6 columns. In one row, the number of dots in that row is equal to the user-specified number of columns. Verify your understanding of this by inspecting the image above.
Hint: make a diagram on paper first and see how you might use a loop variable
to keep track of the x coordinate of the centers of the circles. You
might want to start with the annotated dots diagram shown above.
2.1. Testing create_row
In main(), call create_row to test the function. For example, you could call
create_row with a y_coord of height/2 to create a row of circles in the
middle of the window. Then, once you have the list of circles, add a for loop
in main() to draw each circle in the row. Doing so will give you an image
like the one below.
$ python3 dots.py
Enter the number of rows: 4
Enter the number of columns: 6
Enter the radius of each dot: 20
3. The create_grid function
Once you have create_row working, implement the create_grid function:
def create_grid(num_cols, num_rows, radius):
    """
    Creates a grid of circles num_cols wide and num_rows tall. Each
    circle has the given radius, with each circle spaced 2*radius
    apart both vertically and horizontally. Your implementation must use
    the create_row function to make each row of the grid.
    Args:
        num_cols (int): number of columns
        num_rows (int): number of rows
        radius (int): the radius of the circle
    Returns:
        list: a list of num_cols Circle objects
    """
    # TODO: Implement this function

    # TODO: Change this line so it returns a list of Circles
    return []
This function will use a loop to call the create_row function for
each row, changing the value of the y_coord with each call.
Recall that in the create_row function, you needed to calculate the correct
x-coordinates for the centers of each dot. In create_grid, you will need to
calculate the correct y-coordinates for the centers of each dot.
Since create_row is helping you make the grid in this function, we say that create_row is a helper function. (We will see another function in step 5.)
Again, do not draw the circles in this function. This function just creates the circles and returns them in a list.
In create_grid, use an accumulator to create a big list of all of the
circles. Each time you get another row of circles back from create_row add
them to the big list of circles. When you are done creating the big list storing the
grid of circles, return that list.
| Create a list of circles, not a list of rows! |
Be sure that your create_grid function creates a list of circles.
Do not create a list of rows.
3.1. Testing create_grid
In your main function, remove your test(s) for create_row and instead test
the create_grid function, drawing the entire grid of circles.
Here are two examples of how your code should look at this point:
$ python3 dots.py
Enter the number of rows: 4
Enter the number of columns: 6
Enter the radius of each dot: 20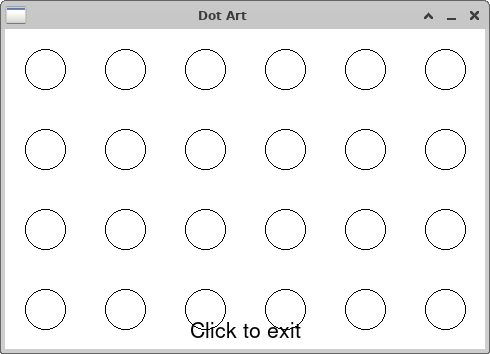
$ python3 dots.py
Enter the number of rows: 5
Enter the number of columns: 3
Enter the radius of each dot: 15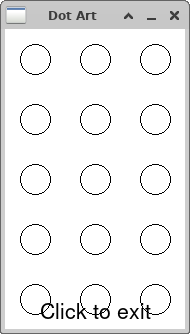
4. The colorize function
Now that we can create a grid of dots, let’s color them with random colors
using the colorize function:
def colorize(circ):
    """
    Sets the fill and outline of a single Circle, circ, to a random color.
    This function does not return anything.
    Args:
        circ (Circle): the circle to color
    """
    # TODO: Implement this function

    # This function has no return value
This function takes a single circle as a parameter and sets the fill
and outline of this circle to a random color. Inside your function, call the
graphics function color_rgb(r, g, b), which takes 3 integers as parameters:
the red, green, and blue components of the color. Each component color
value is between 0 and 255 (inclusive). Using the random library, choose
random values for each component. When you have three random values,
create a color using color_rgb. The return value of color_rgb can
then be used just like any other color:
>>> color = color_rgb(128, 255, 0)  # a light greenish color
>>> circle.setFill(color)
After choosing a random color, this function will change both the fill and outline color of the circle to this random color. There is no return value from this function.
After you’ve completed this function, use it to change the fill and outline of every circle in your grid. Call the function inside the loop you have been using to draw the circles.
4.1. Testing colorize
Below are a few example runs. Since the colors are random, you should get something similar but of course the colors will not match.
$ python3 dots.py
Enter the number of rows: 6
Enter the number of columns: 8
Enter the radius of each dot: 15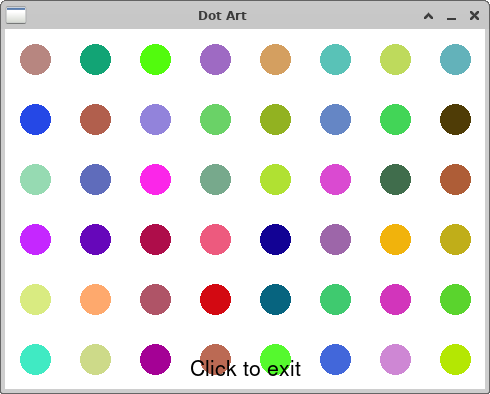
$ python3 dots.py
Enter the number of rows: 5
Enter the number of columns: 3
Enter the radius of each dot: 25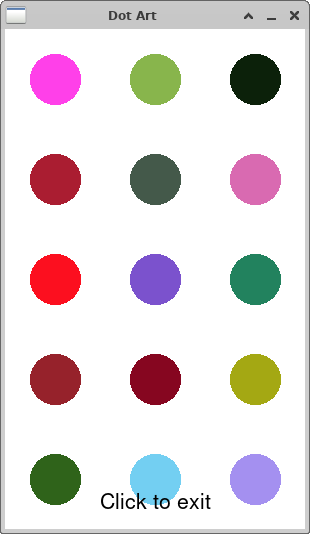
5. Clicking on dots
5.1. The inside_circle function
We have provided you with the code for the function point_distance(pt1, pt2) which calculates the distance between pt1 and pt2 using the Pythagorean theorem. Use that to write the function inside_circle:
def inside_circle(circ, pt):
    """
    This function returns True if the Point pt is inside of the Circle,
    circ. You must use the point_distance function provided as part of your
    solution.
    Args:
        pt (Point)
        circ (Circle)
    Returns:
        bool: is the Point inside the Circle?
    """
    # TODO: Implement this function

    # TODO: Change this line so it returns the appropriate value
    return True
The inside_circle function takes a Circle and a Point as parameters and returns
True if the Point is located inside a Circle; otherwise, it returns False. Use the point_distance function as a helper function. A point is inside the circle if the distance from the center of the circle to the point is less than or equal to the
radius of the circle.
5.2. Using the inside_circle function
In main(), after you have drawn all of the circles, add another loop that will
allow the user to click 10 times. Recall that you can get the location where the
user clicks using the getMouse function:
# assumes that the variable `window` stores your GraphWin object
click_point = window.getMouse()  # getMouse returns a Point where the user clicked
Given a single click of the mouse, your job is to determine if the point
returned by getMouse is inside any of the circles in the grid of circles.
If you the point was inside one of the circles, use the colorize function to give the circle a different random color.
Here is a video how this will work. Note that you should not draw a black circle where the user is clicking, this is just to help you see where the user clicked in this demonstration.
6. Shaking the grid of dots
6.1. The shake_grid function
In the last step of the lab, implement the function shake_grid:
def shake_grid(grid):
    """
    Randomly move all the circles on the grid. This function does not
    return anything.
    Args:
        grid (list): a list of Circles
    """
    # TODO: Implement this function

    # This function has no return value
The shake_grid function takes a list of circles and randomly moves each circle a
random small amount in the x and y directions. For example, you might randomly
move -1, 0, or 1 pixels in the x direction and randomly move -1, 0, or 1 pixels in the
y direction. The function should loop through all of the circles in the grid and move
each circle a different random x and random y value. Since the circles are
mutated, there is no return value from the function.
6.2. Using the shake_grid function
Once you have shake_grid written, call the shake_grid function repeatedly
in a loop from main(). You can decide how long to delay between calls to
shake_grid, as well as how many times to shake the grid, before
exiting the program. Recall that you can put delays in your animations
by using the sleep function imported from the time library. Calling
sleep(1) will delay for 1 second; sleep(0.25) will delay for 0.25 seconds.
Here is a video demonstrating a possible complete solution. Again, note that you should not draw a black circle where the user is clicking, this is just to help you see where the user clicked in the demonstration.
If your program works similarly to the video shown above, you’re done with the lab!!
7. OPTIONAL: Extra Challenges
Just for fun, try some of these extra challenges:
-
(Optional) If the user clicks outside of any circle, change the background color to a random color.
-
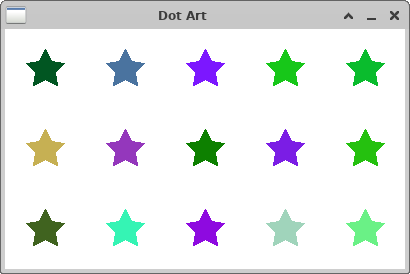
(Optional) Instead of creating circles, try creating other shapes like stars, diamonds, ovals, or any other shape you’d like. Here’s a grid of stars:
-
(Optional) Instead of choosing completely random colors, make your colors all have various shades of red, blue, or some other shade you like. Here’s a blue palette:
-
(Optional) Use the
checkMousefunction instead of thegetMousefunction so that users can click on the circles while they are shaking. -
(Optional) Instead of shaking a fixed number of times, use the
checkKeyfunction to keep shaking until the user presses the letter"q". -
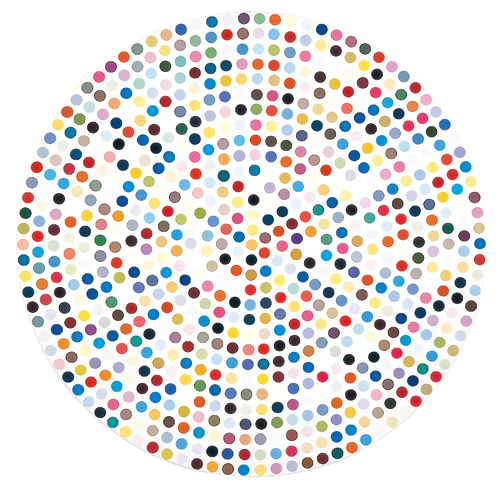
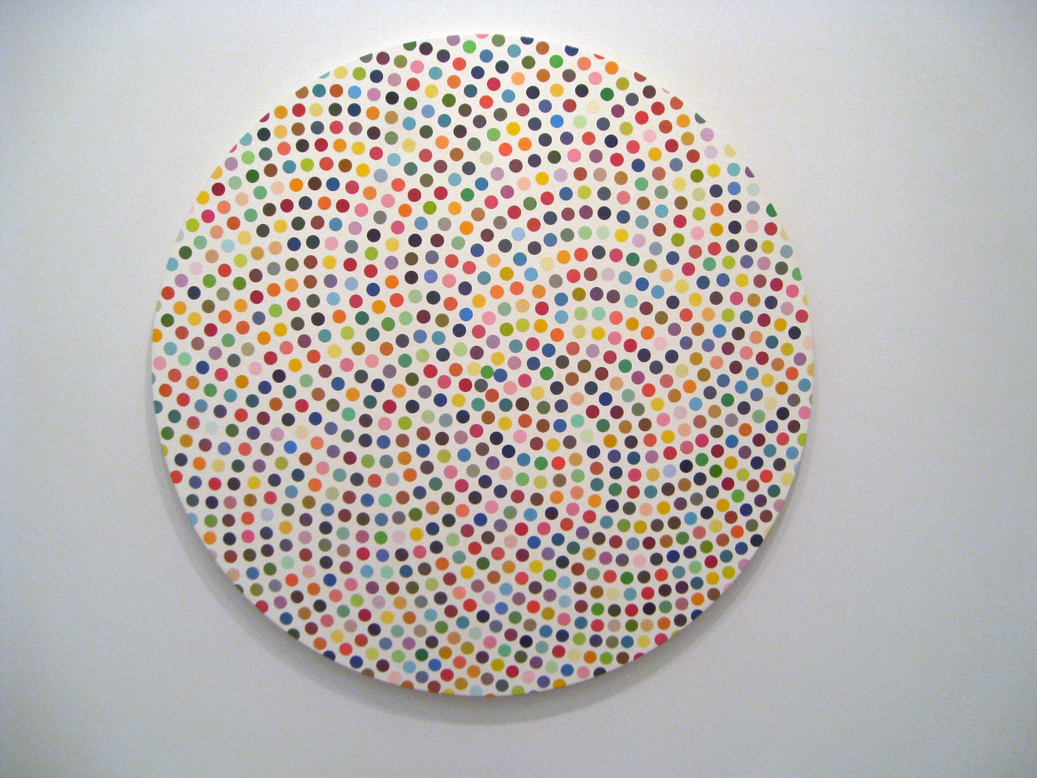
(Optional) Here are a few more examples of Damien Hirst’s work - feel free to create related examples, either exactly replicated or loosely inspired.
-
Rows have an uneven number of dots ("Morphine Sulphate"):
-
Dots are arranged in a circle ("ZDP"):
-
Dots are arranged in a spiral inside a circle ("Valium"):
-
8. Answer the Questionnaire
Each lab will have a short questionnaire at the end. Please edit
the Questions-06.txt file in your cs21/labs/06 directory
and answer the questions in that file.
Once you’re done with that, you should run handin21 again.
Submitting lab assignments
Remember to run handin21 to turn in your lab files! You may run handin21
as many times as you want. Each time it will turn in any new work. We
recommend running handin21 after you complete each program or after you
complete significant work on any one program.
Logging out
When you’re done working in the lab, you should log out of the computer you’re using.
First quit any applications you are running, like the browser and the
terminal. Then click on the logout icon ( or
or
 ) and choose "log out".
If you plan to leave the lab for just a few minutes, you do not need to log
out. It is, however, a good idea to lock your machine while you are gone. You
can lock your screen by clicking on the lock  icon.
PLEASE do not leave a session locked for a long period of time. Power may go
out, someone might reboot the machine, etc. You don’t want to lose any work!
icon.
PLEASE do not leave a session locked for a long period of time. Power may go
out, someone might reboot the machine, etc. You don’t want to lose any work!